
Rising incomes in the last 50 years allowed Americans to cut the budget shares devoted to food
- by Economic Research Service
- 11/1/2012
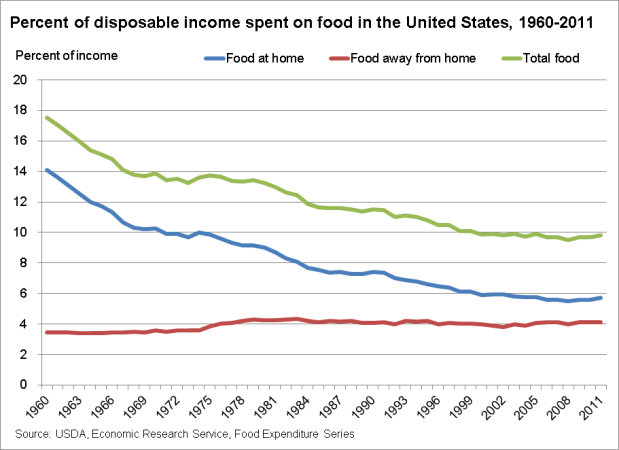
Between 1960 and 2011, the share of disposable personal income spent on total food by Americans fell from 17.5 percent to 9.8 percent, and the share of food at home fell from 14.1 percent to 5.7 percent. At the same time, the percentage of income spent on food away from home increased from 3.4 to 4.1 percent. Although per capita total food spending adjusted for inflation increased over this period, by 33 percent, inflation-adjusted per capita income increased more rapidly, by 141 percent. This caused spending as a share of income to drop, allowing consumers to spend more money on other necessities and non-necessities. During the 2007-09 recession and beyond, the share of income spent on all three categories leveled off as incomes stagnated. This chart is based on data from the ERS Food Expenditure Series data product, updated October 2012.