
Food prices less volatile than fuel prices
- by Economic Research Service
- 9/27/2012
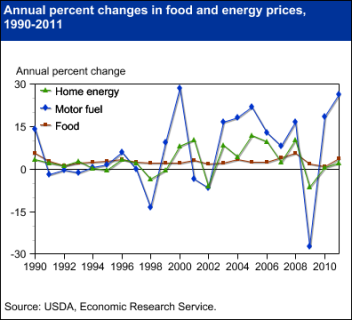
Rising fuel prices can raise questions about the implications for food prices. Motor fuel prices for the first eight months of 2012 were 3 percent higher than those from the same time in 2011, which in turn were 28 percent higher than 2010 prices. Food prices usually move in the same direction as fuel prices, often with a slight lag as fuel costs are incorporated into food prices. However, while the direction is often the same, the sizes of the price swings differ. Over the last two decades, motor fuel prices have experienced both double-digit annual increases and similarly large annual decreases, with an average price change of 11.5 percent per year. Food prices, on the other hand, have only posted annual increases in the last 20 years of between 1 and 6 percent, for an average annual increase of 2.7 percent. Home energy prices, which incorporate other sources of energy, are also considerably more volatile than food prices. More information on food price changes and forecasts can be found in the Food Price Outlook data product, updated September 25, 2012.