
A majority of U.S. cotton textile exports stay within North America
- by Economic Research Service
- 9/25/2012
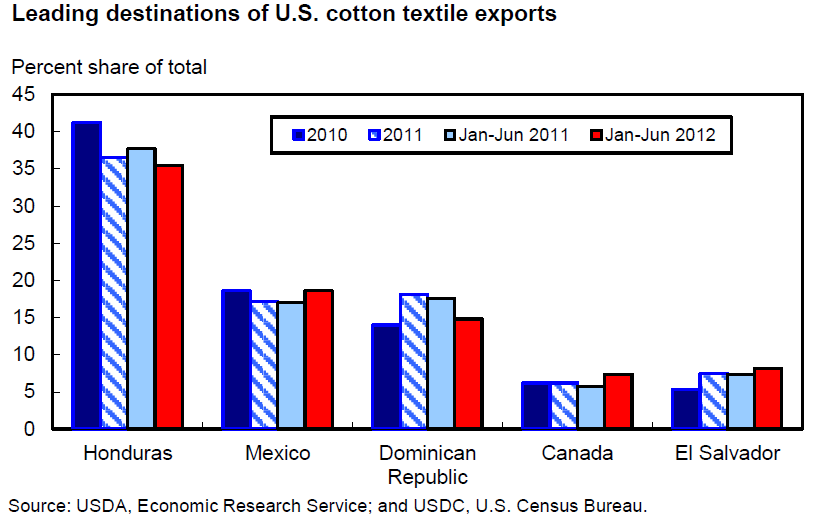
Cotton products continue to account for most of U.S. textile and apparel trade, although there have been recent declines as a result of fiber substitution. Through the first 6 months of 2012, U.S. cotton product imports and exports reached 3.8 billion pounds and 962 million pounds, respectively. For U.S. cotton product exports, the top five destinations accounted for a steady share of nearly 85 percent of total exports. Of the top five destinations, only exports to Canada were higher than the comparable period of 2011. The share of total exports was mixed for the top countries. Honduras was the leading destination but its share is declining, falling below 36 percent during the first half of 2012; the share also decreased for the Dominican Republic. For Mexico--the second leading destination--the share rose to nearly 19 percent, similar to calendar year 2010; the shares for El Salvador and Canada continued their trend higher during the first half of 2012. This chart is found in the Cotton and Wool Outlook, CWS-12g, September 2012.