
Prevalence of food insecurity has changed little since 2008-09
- by Economic Research Service
- 9/6/2012
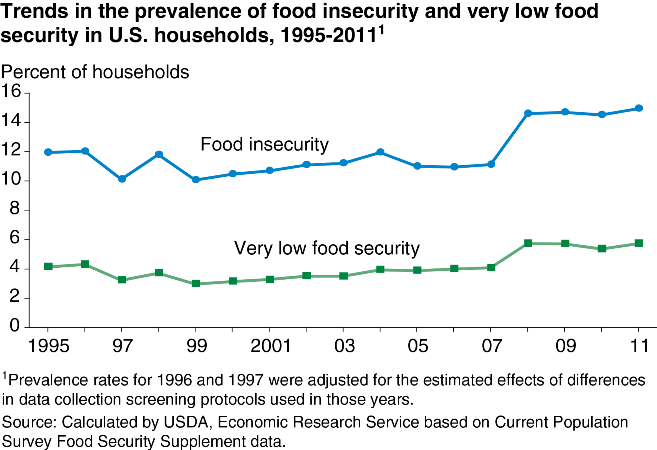
In 2011, 85.1 percent of U.S. households were food secure throughout the year, meaning that they had dependable access to enough food for active healthy living. The remaining 14.9 percent of households were food insecure at least some time during the year, including 5.7 percent (6.8 million households) that had very low food security. In households experiencing very low food security, food intake of one or more members was reduced and normal eating patterns were disrupted. In 2011, the prevalence of very low food security returned to the level observed in 2008 and 2009, up from 5.4 percent in 2010. This chart is from Household Food Security in the United States in 2011, ERR-141, released on September 5, 2012.