
Trends in farm real estate values
- by Economic Research Service
- 2/28/2012
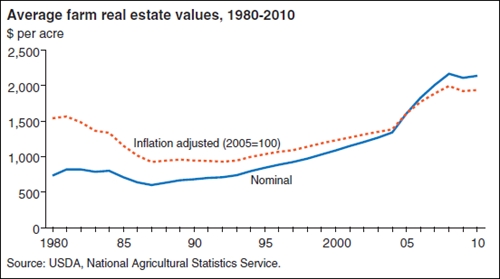
Because farm real estate represents much of the value of U.S. farm sector assets, large swings in farmland values can affect the financial well-being of agricultural producers. Since the farm crisis of the mid-1980s, farm real estate values (including land and buildings) have been rising in both nominal and real (i.e., inflation adjusted) terms. Between 1994 and 2004, real values increased between 2 and 4 percent annually. In 2005 and 2006, values jumped 16 percent and 11 percent, before slowing to 6-7 percent in 2007 and 2008. This chart comes from the ERS report, Trends in U.S. Farmland Values and Ownership, EIB-92, February 2012.