
Nonmetro high-minority counties
- by Economic Research Service
- 10/19/2011
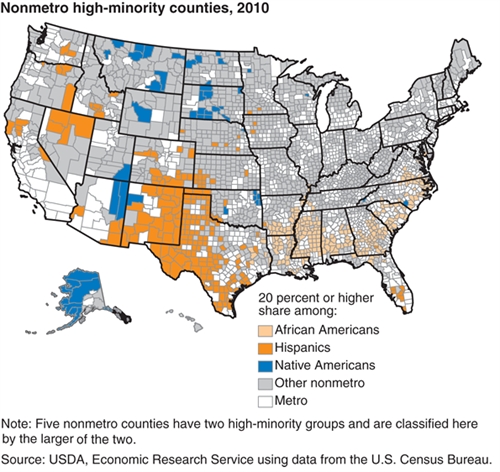
Despite relatively low population shares in nonmetro areas nationally (compared with metro areas), specific racial and ethnic groups are concentrated in some rural regions. In 2010, the African American share of population exceeded 20 percent in 290 nonmetro counties, almost all located in the Southeast. The Southwest and West contained the vast majority of the 211 nonmetro counties with 20 percent or more Hispanics, while the Northern Great Plains included most of the 57 counties with high shares of Native Americans. This map is from the 2011 edition of Rural America At A Glance, EIB-85, September 2011.