
Global cotton trade rises in 2010/11
- by Economic Research Service
- 3/23/2011
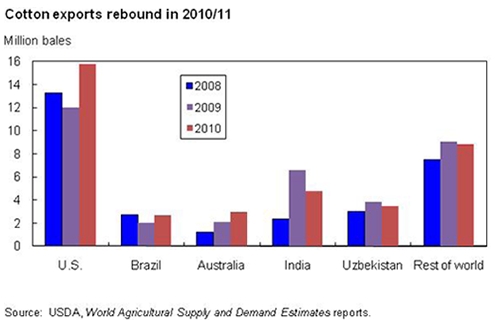
As of March 2011, world cotton exports in 2010/11 are estimated at 38.6 million bales, up 9 percent from the previous year and the second consecutive year of trade rebound. Exports in 2010/11 for Australia (3.0 million bales), Brazil (2.7 million), and the United States (15.75 million) are estimated to increase 42 percent, 36 percent, and 27 percent, respectively, from the preceding year. India and Uzbekistan are estimated to export 4.8 million bales and 3.5 million bales in 2010/11, down 27 percent and 8 percent, respectively, from a year ago. Export increases in several major countries more than offset declines in other exporting countries, resulting in one of the largest cotton trade volumes in recent years. This chart was originally published in Cotton and Wool Outlook, CWS-11a, March 11, 2011.