
Contracting expands for field crops
- by Economic Research Service
- 3/7/2011
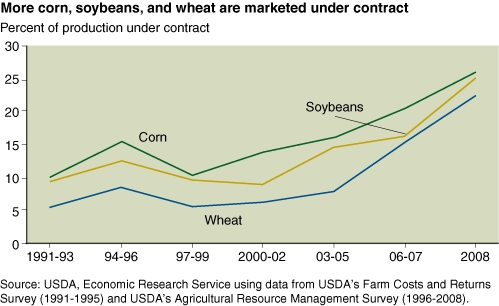
Most U.S. corn, soybean, and wheat production is sold through cash markets, where the producer receives the market price prevailing at the time of sale. However, marketing contracts, which set a market outlet and a pricing arrangement for crops before they are harvested, are becoming increasingly important as risk management tools. Marketing contracts covered 15 percent of corn production in 2001, along with 9 percent of soybean and 6 percent of wheat production. By 2008, contracts covered 26 percent of corn, 25 percent of soybean, and 23 percent of wheat production. This chart originally appeared in the March 2011 issue of Amber Waves. It is based on the ERS publication, Agricultural Contracting Update: Contracts in 2008, EIB-72, February 2011.