
Growing demand for U.S. ethanol reflected in climbing blend rates and strengthening exports
- by Steven Ramsey
- 8/28/2025
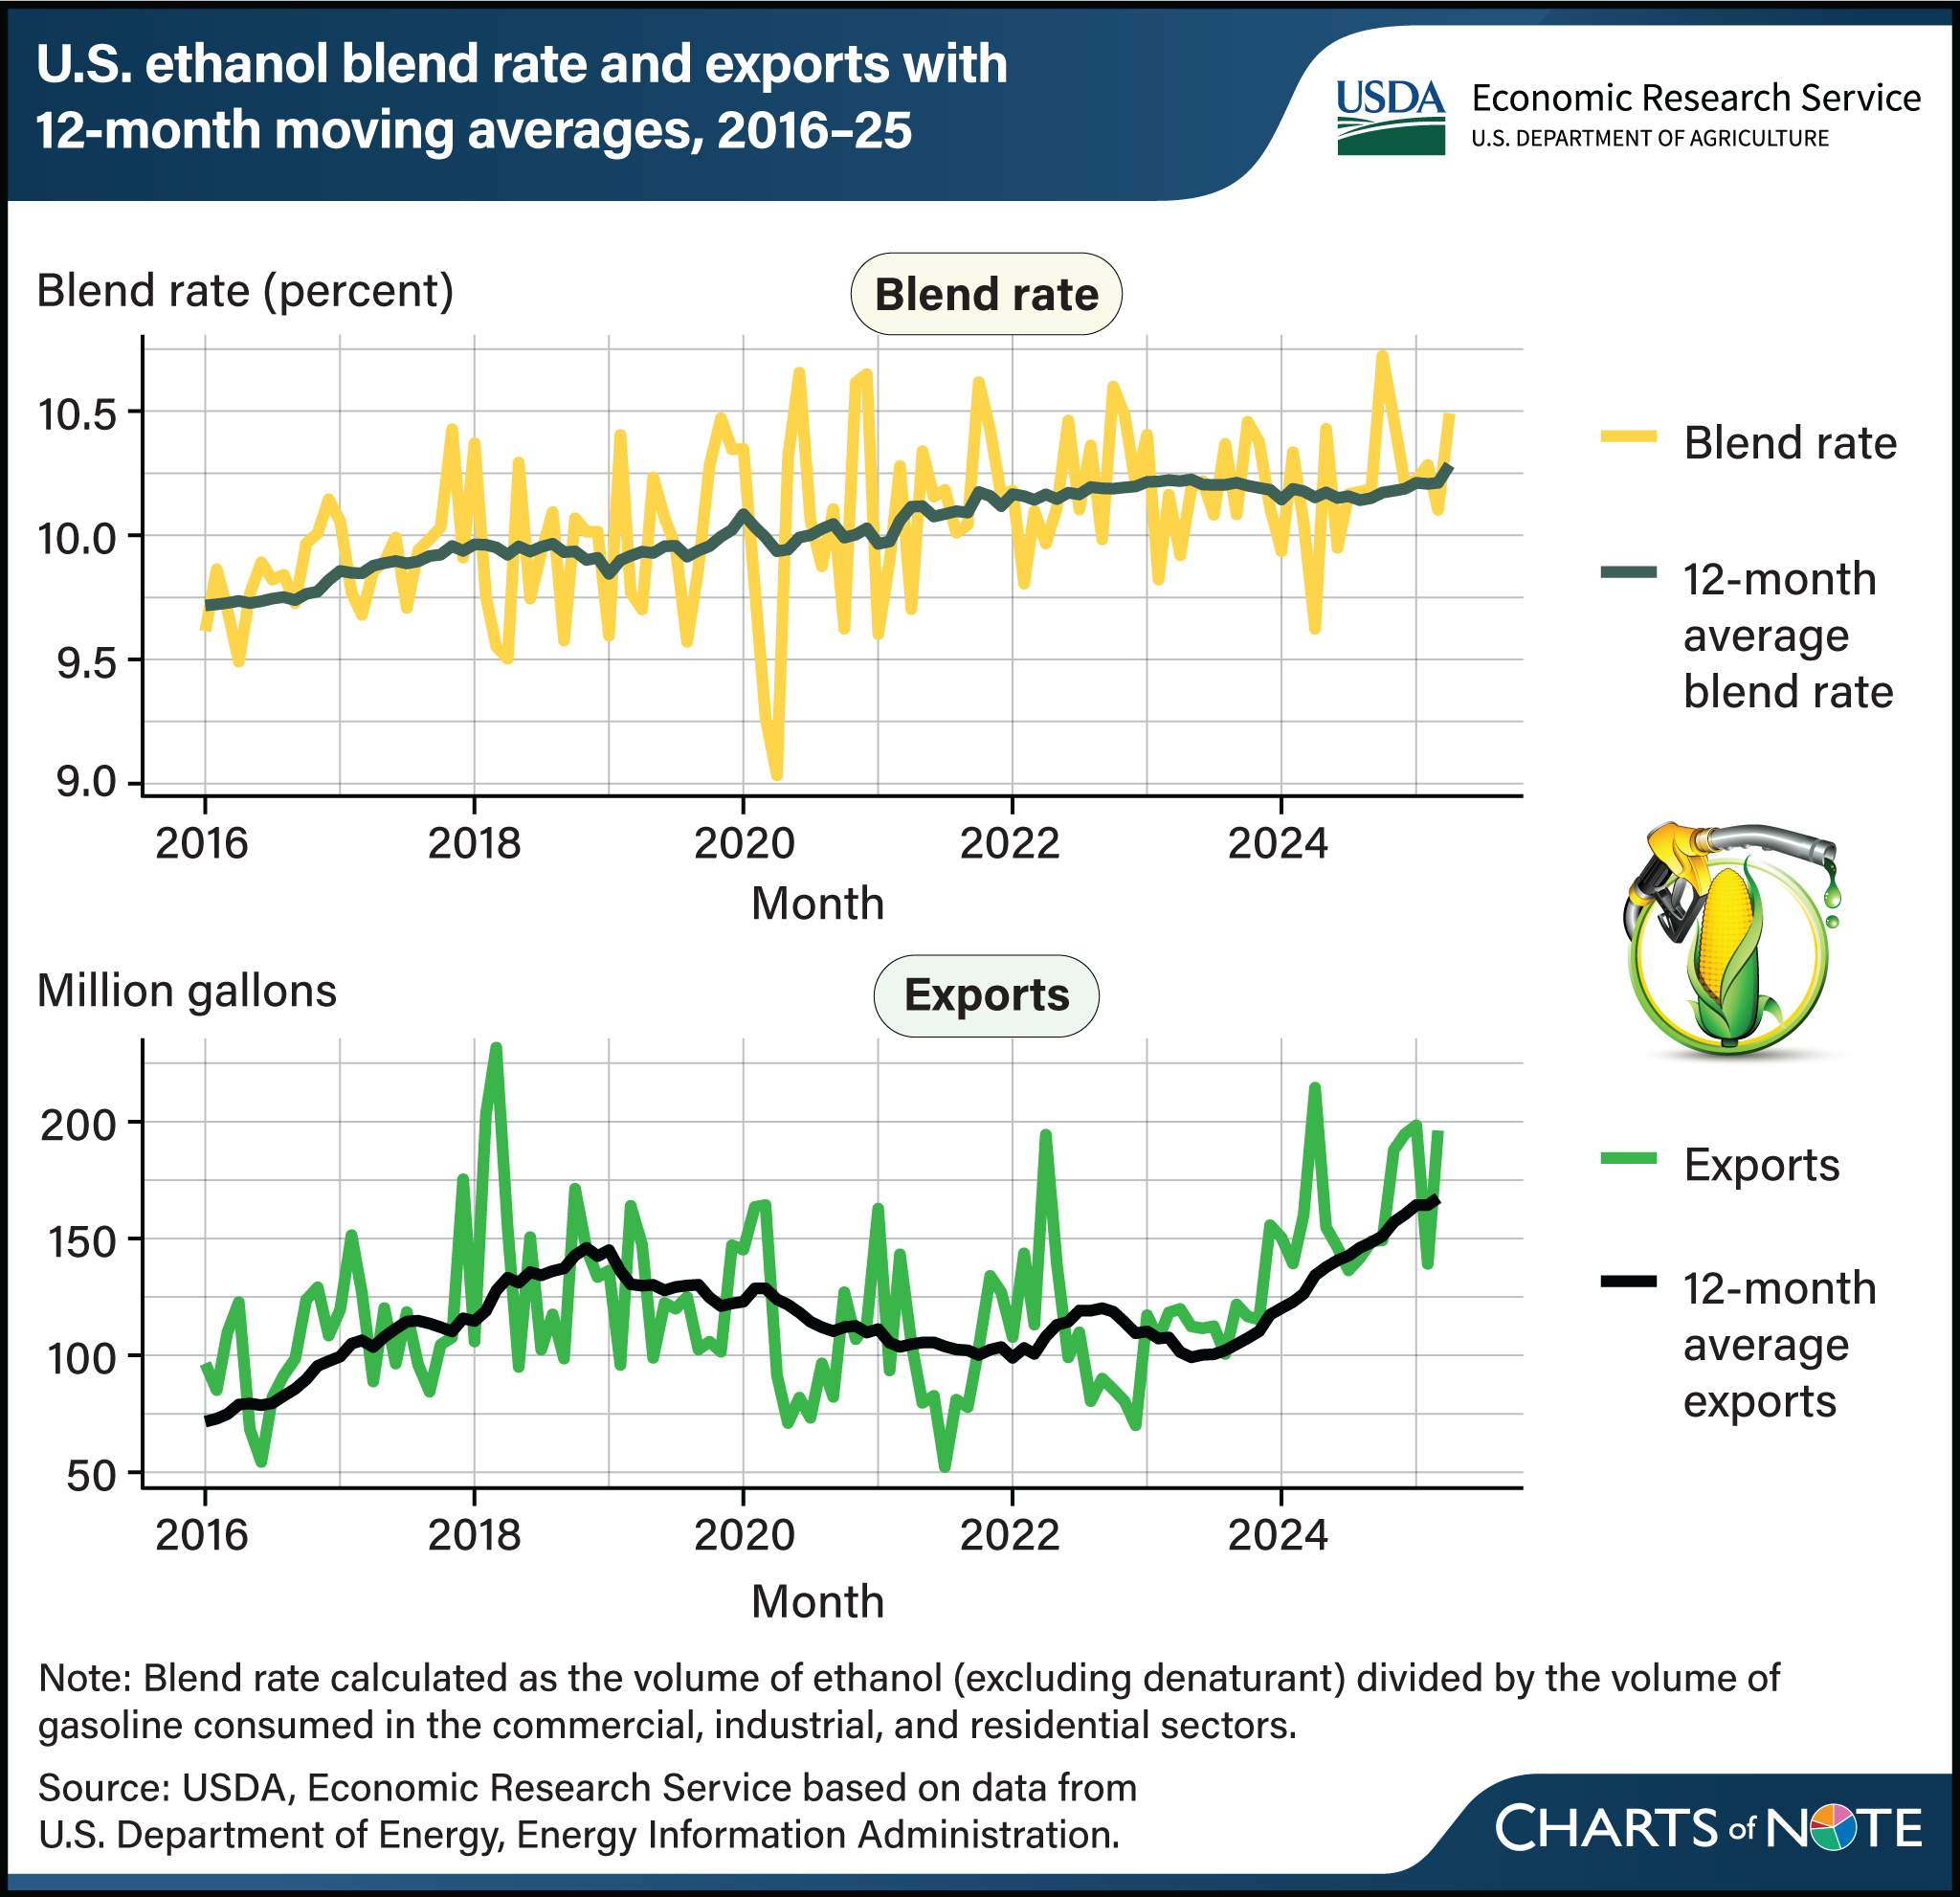
Total demand for U.S. fuel ethanol has grown since 2016. Domestically, ethanol is primarily produced from corn and blended with gasoline to increase octane and meet Federal mandates. The blend rate—ethanol’s percentage of finished motor gasoline volume—is one indicator of gasoline blenders’ demand for ethanol for vehicle fuel. Data from March 2025 showed the U.S. average blend rate was 10.1 percent, the ninth consecutive month above the implied minimum Federal blend rate of 10 percent, while the 12-month moving average blend rate stood at 10.2 percent. The average blend rate has largely been at 10 percent or higher since 2020. Increasing blend rates have helped maintain domestic ethanol consumption at a steady level despite reduced demand for finished motor gasoline. Moreover, since 2023, international demand for ethanol has steadily risen and provided additional support for U.S. fuel ethanol production. In March 2025, U.S. ethanol exports rose to their fifth-highest monthly total of all time—196 million gallons, up from 110 million gallons in March 2016—pushing the 12-month-average export level to a record-high 167 million gallons. Elevated blend rates and rising ethanol exports both support growing demand for U.S. corn. To meet March 2025 demand for fuel ethanol (consumption plus exports) required the equivalent of about 465 million bushels of corn, a 60-million bushel increase over monthly demand a decade ago. This chart is drawn from USDA, Economic Research Service’s Bioenergy Statistics data.
We’d welcome your feedback!
Would you be willing to answer a few quick questions about your experience?