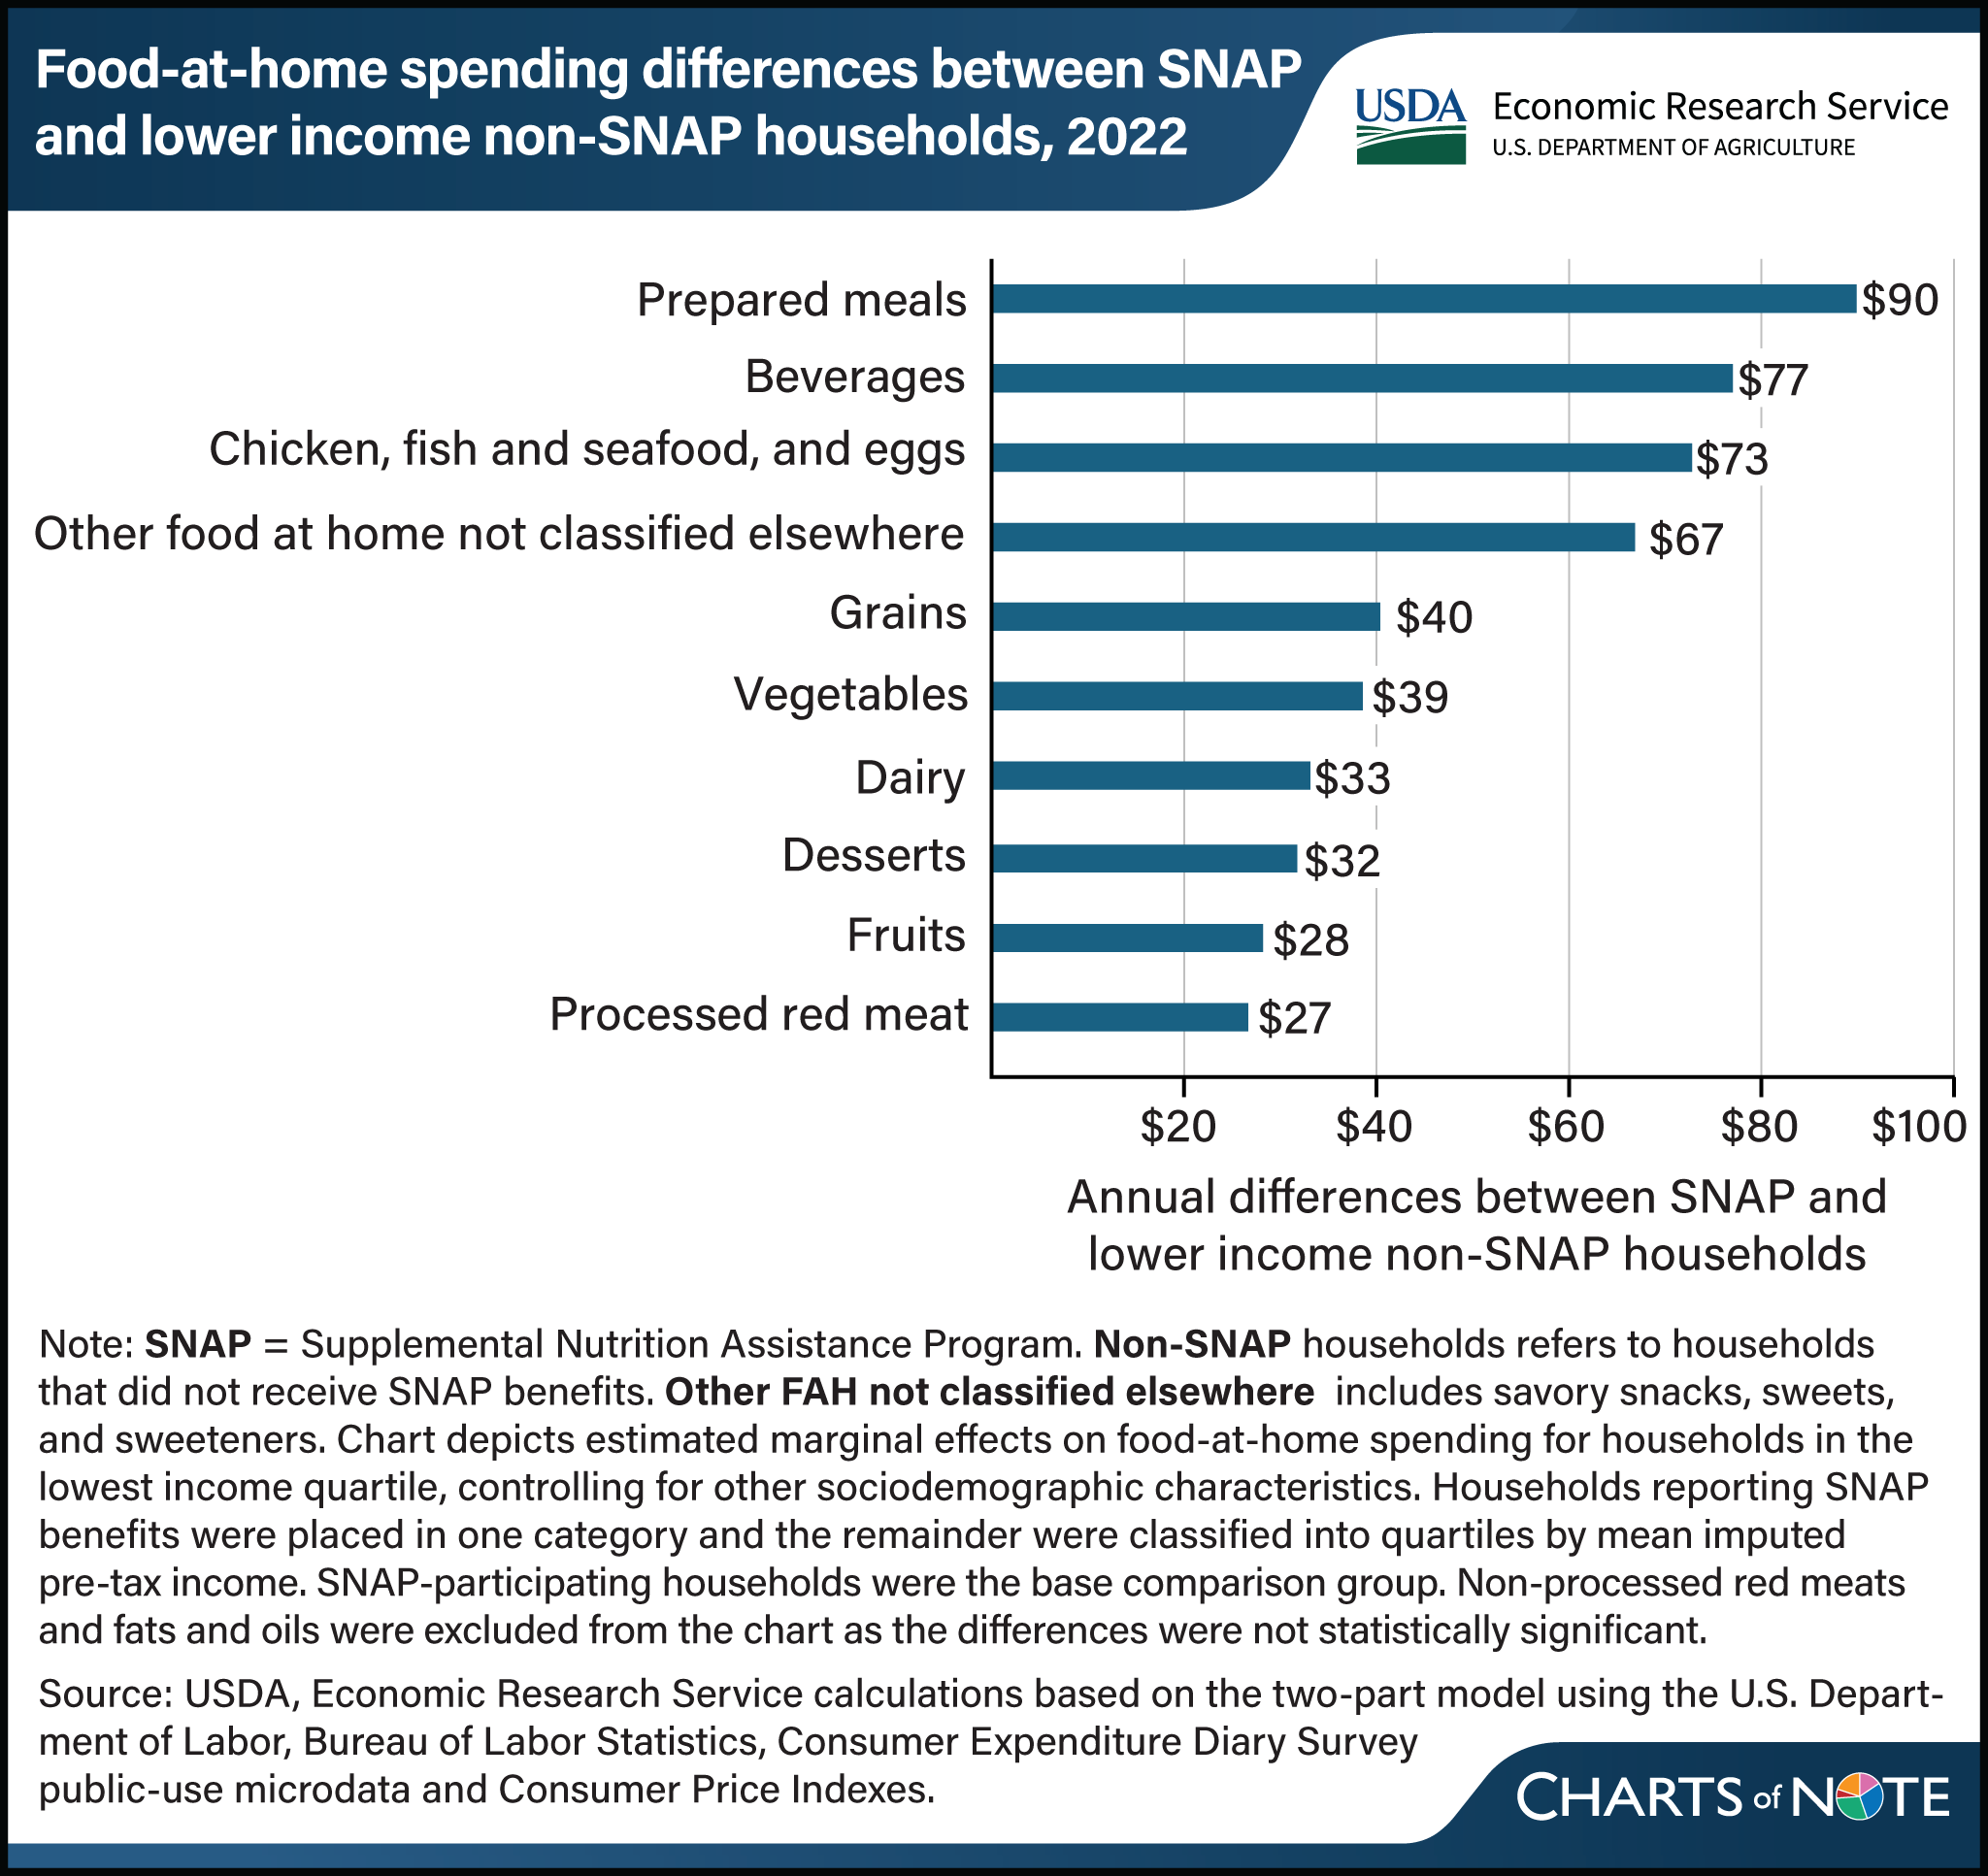
SNAP households spent about $544 more on food at home than non-SNAP households in the lowest income quartile in 2022
- by Eliana Zeballos and Abigail Okrent
- 6/11/2025

In 2022, households participating in USDA’s Supplemental Nutrition Assistance Program (SNAP) spent $544 more on food at home than non-SNAP households in the lowest income quartile. Households participating in SNAP receive monthly benefits that can be used to purchase food items at authorized retailers via an electronic system known as electronic benefit transfer (EBT). Benefits increase with household size and decrease with household income and can be redeemed for most types of foods. In 2022, spending differences between SNAP households and non-SNAP households in the lowest income quartile varied among food-at-home categories. SNAP household differences ranged from $90 more on prepared meals to $27 more on processed red meat compared to non-participating households in the lowest income quartile. Differences in households’ food spending patterns can have implications for food consumption, dietary quality, and overall health outcomes. This chart was drawn from the ERS report, U.S. Household Food Spending Post COVID-19 and the Implications for Diet Quality, published May 2025.

