
Most States with high net farm income saw growth in 2022
- by Farm Income Team
- 11/21/2023
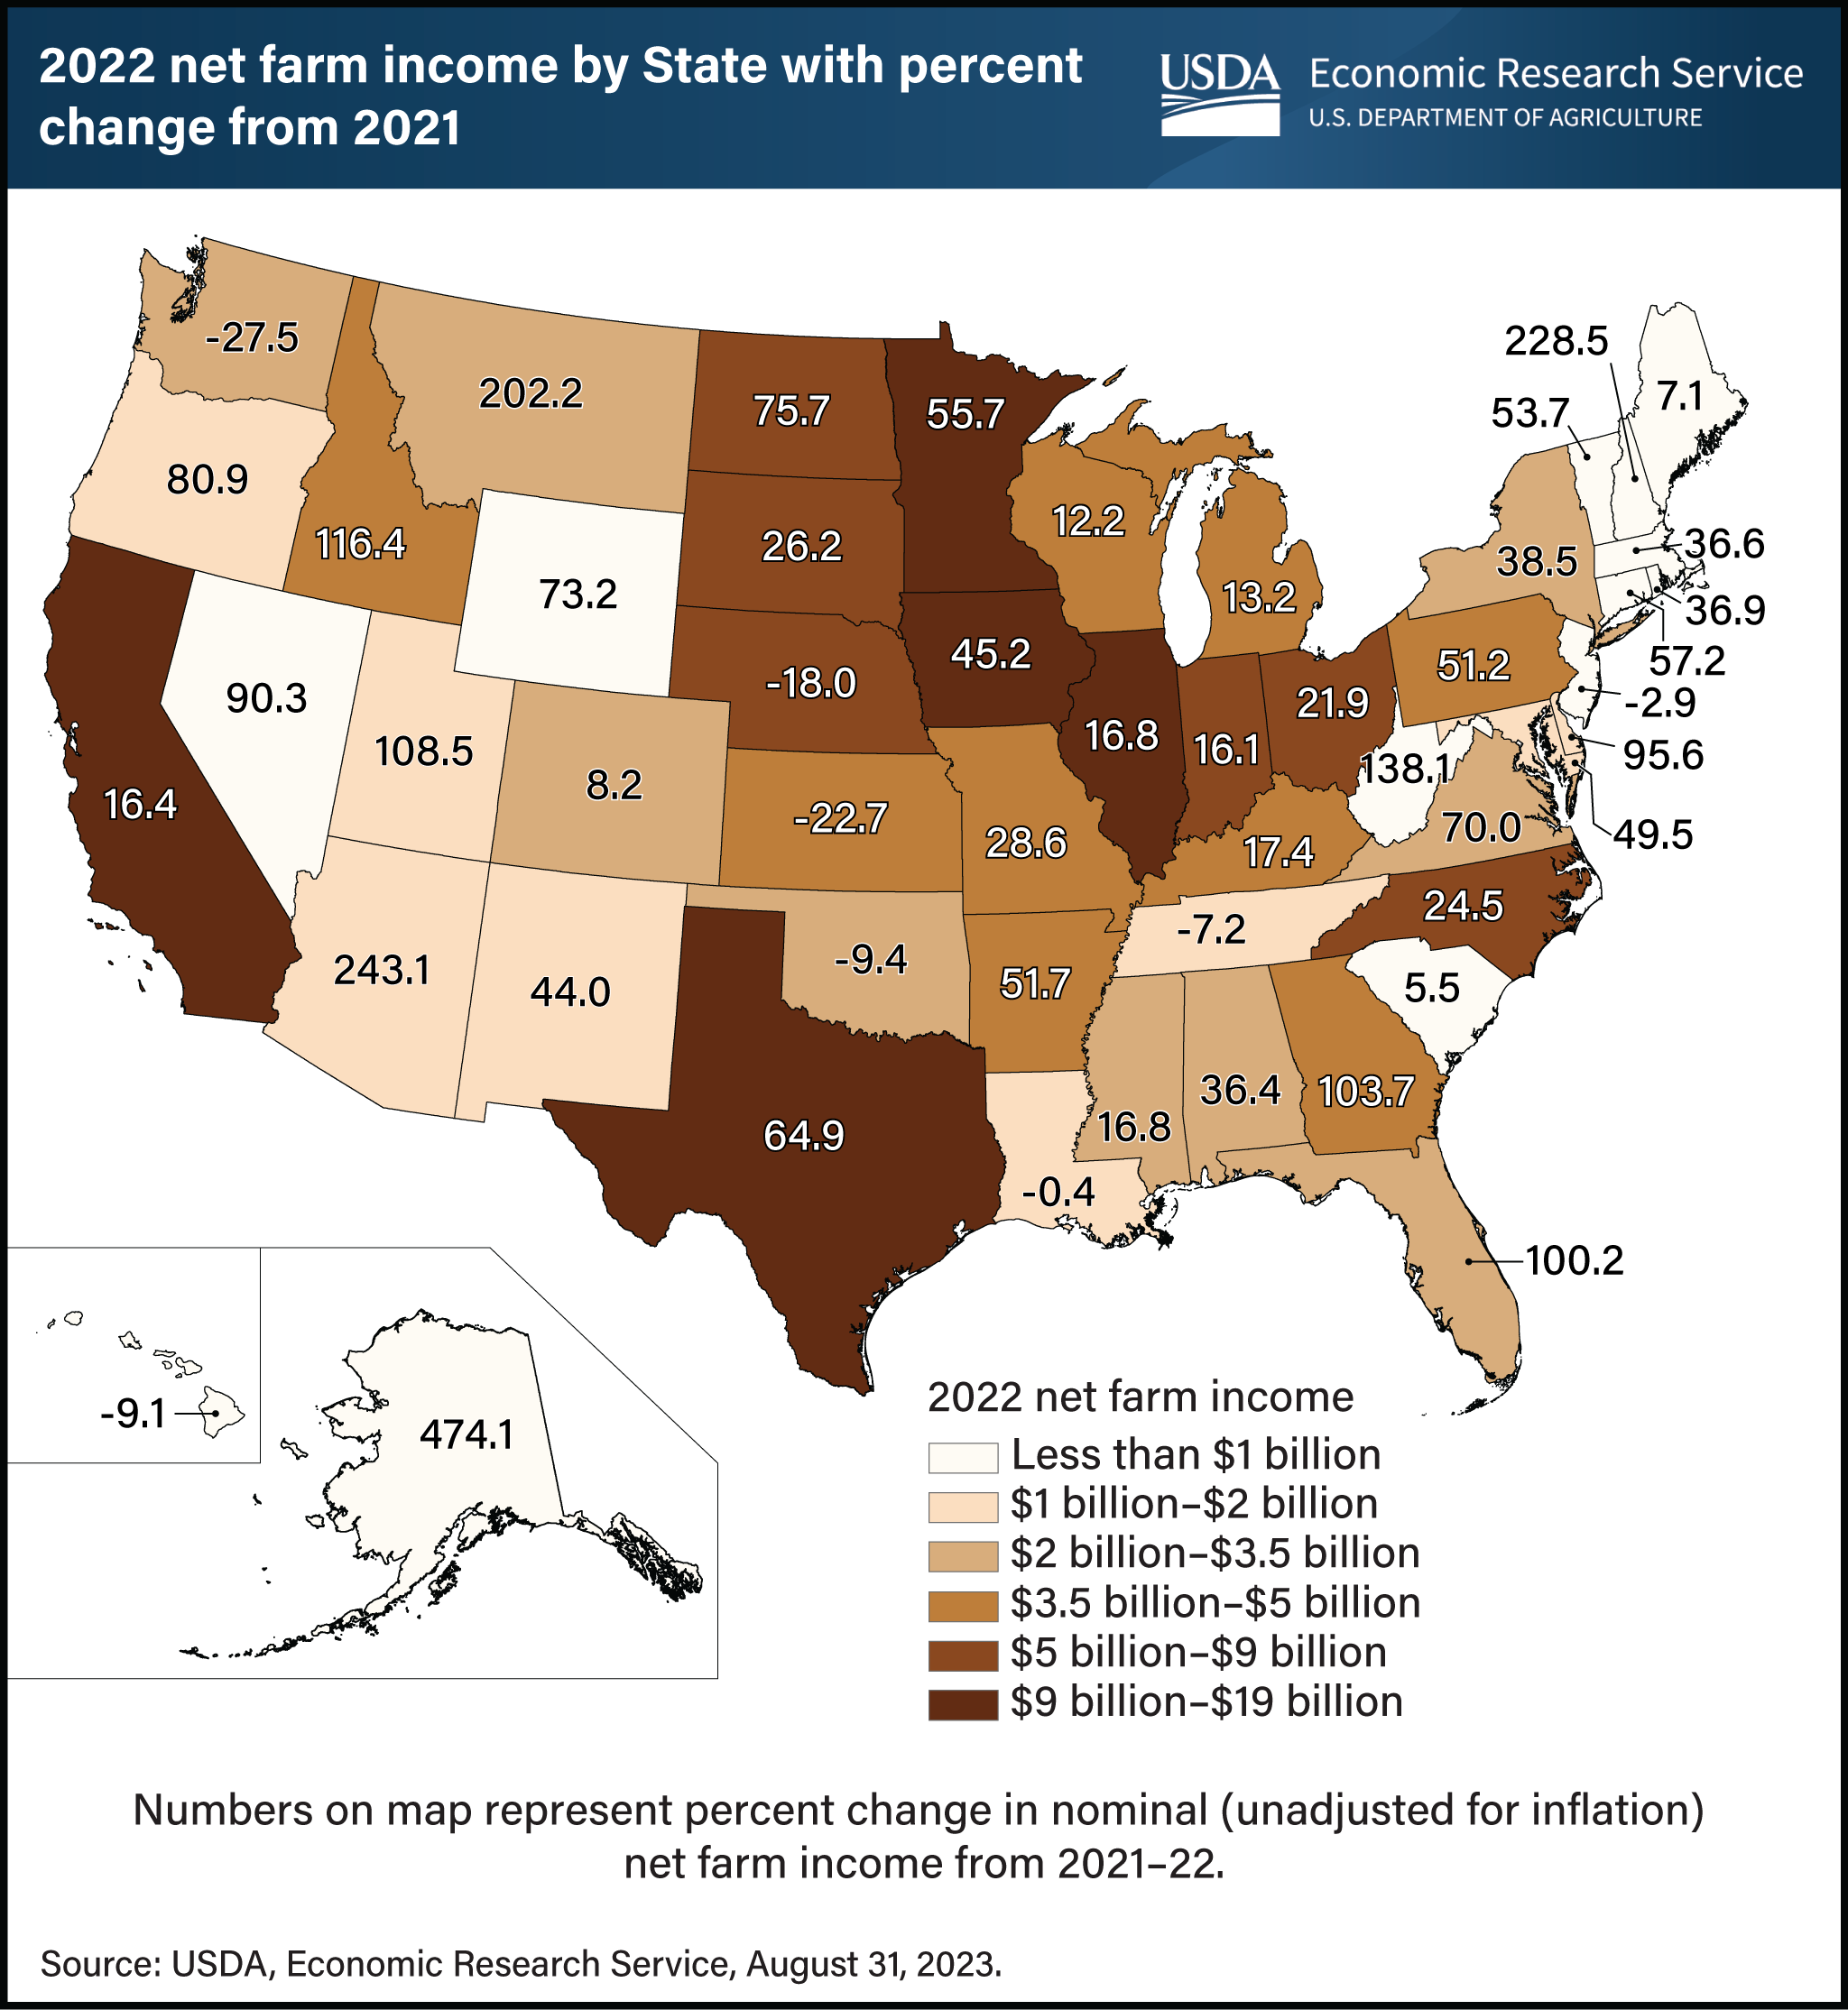
The United States saw growth of 30.7 percent in net farm income (NFI) from 2021 to 2022. NFI is a broad measure of farm sector profitability that incorporates noncash items such as depreciation and gross imputed rental income. Researchers with USDA, Economic Research Service (ERS) used data in the Farm Income and Wealth Statistics to classify States into six categories based on 2022 NFI. Among the 5 agricultural States with the highest NFI, Texas had the highest NFI growth at 64.9 percent from 2021 to 2022, followed by Minnesota with 55.7 percent. Growth in the remaining top five States (California, Iowa, and Illinois) also was strong. Other States among the top 25 for average NFI had a wide range of NFI change from 2021 to 2022. Many showed strong growth, such as Idaho (116.4 percent), Georgia (103.7 percent), Florida (100.2 percent), and North Dakota (75.7 percent). However, NFI in Kansas and Washington fell 22.7 percent and 27.5 percent, respectively. Find additional information and analysis on the ERS topic page for Farm Economy.