
Irrigated agricultural acreage has grown, shifting eastward, while western irrigated acreage has declined
- by R. Aaron Hrozencik
- 9/27/2023
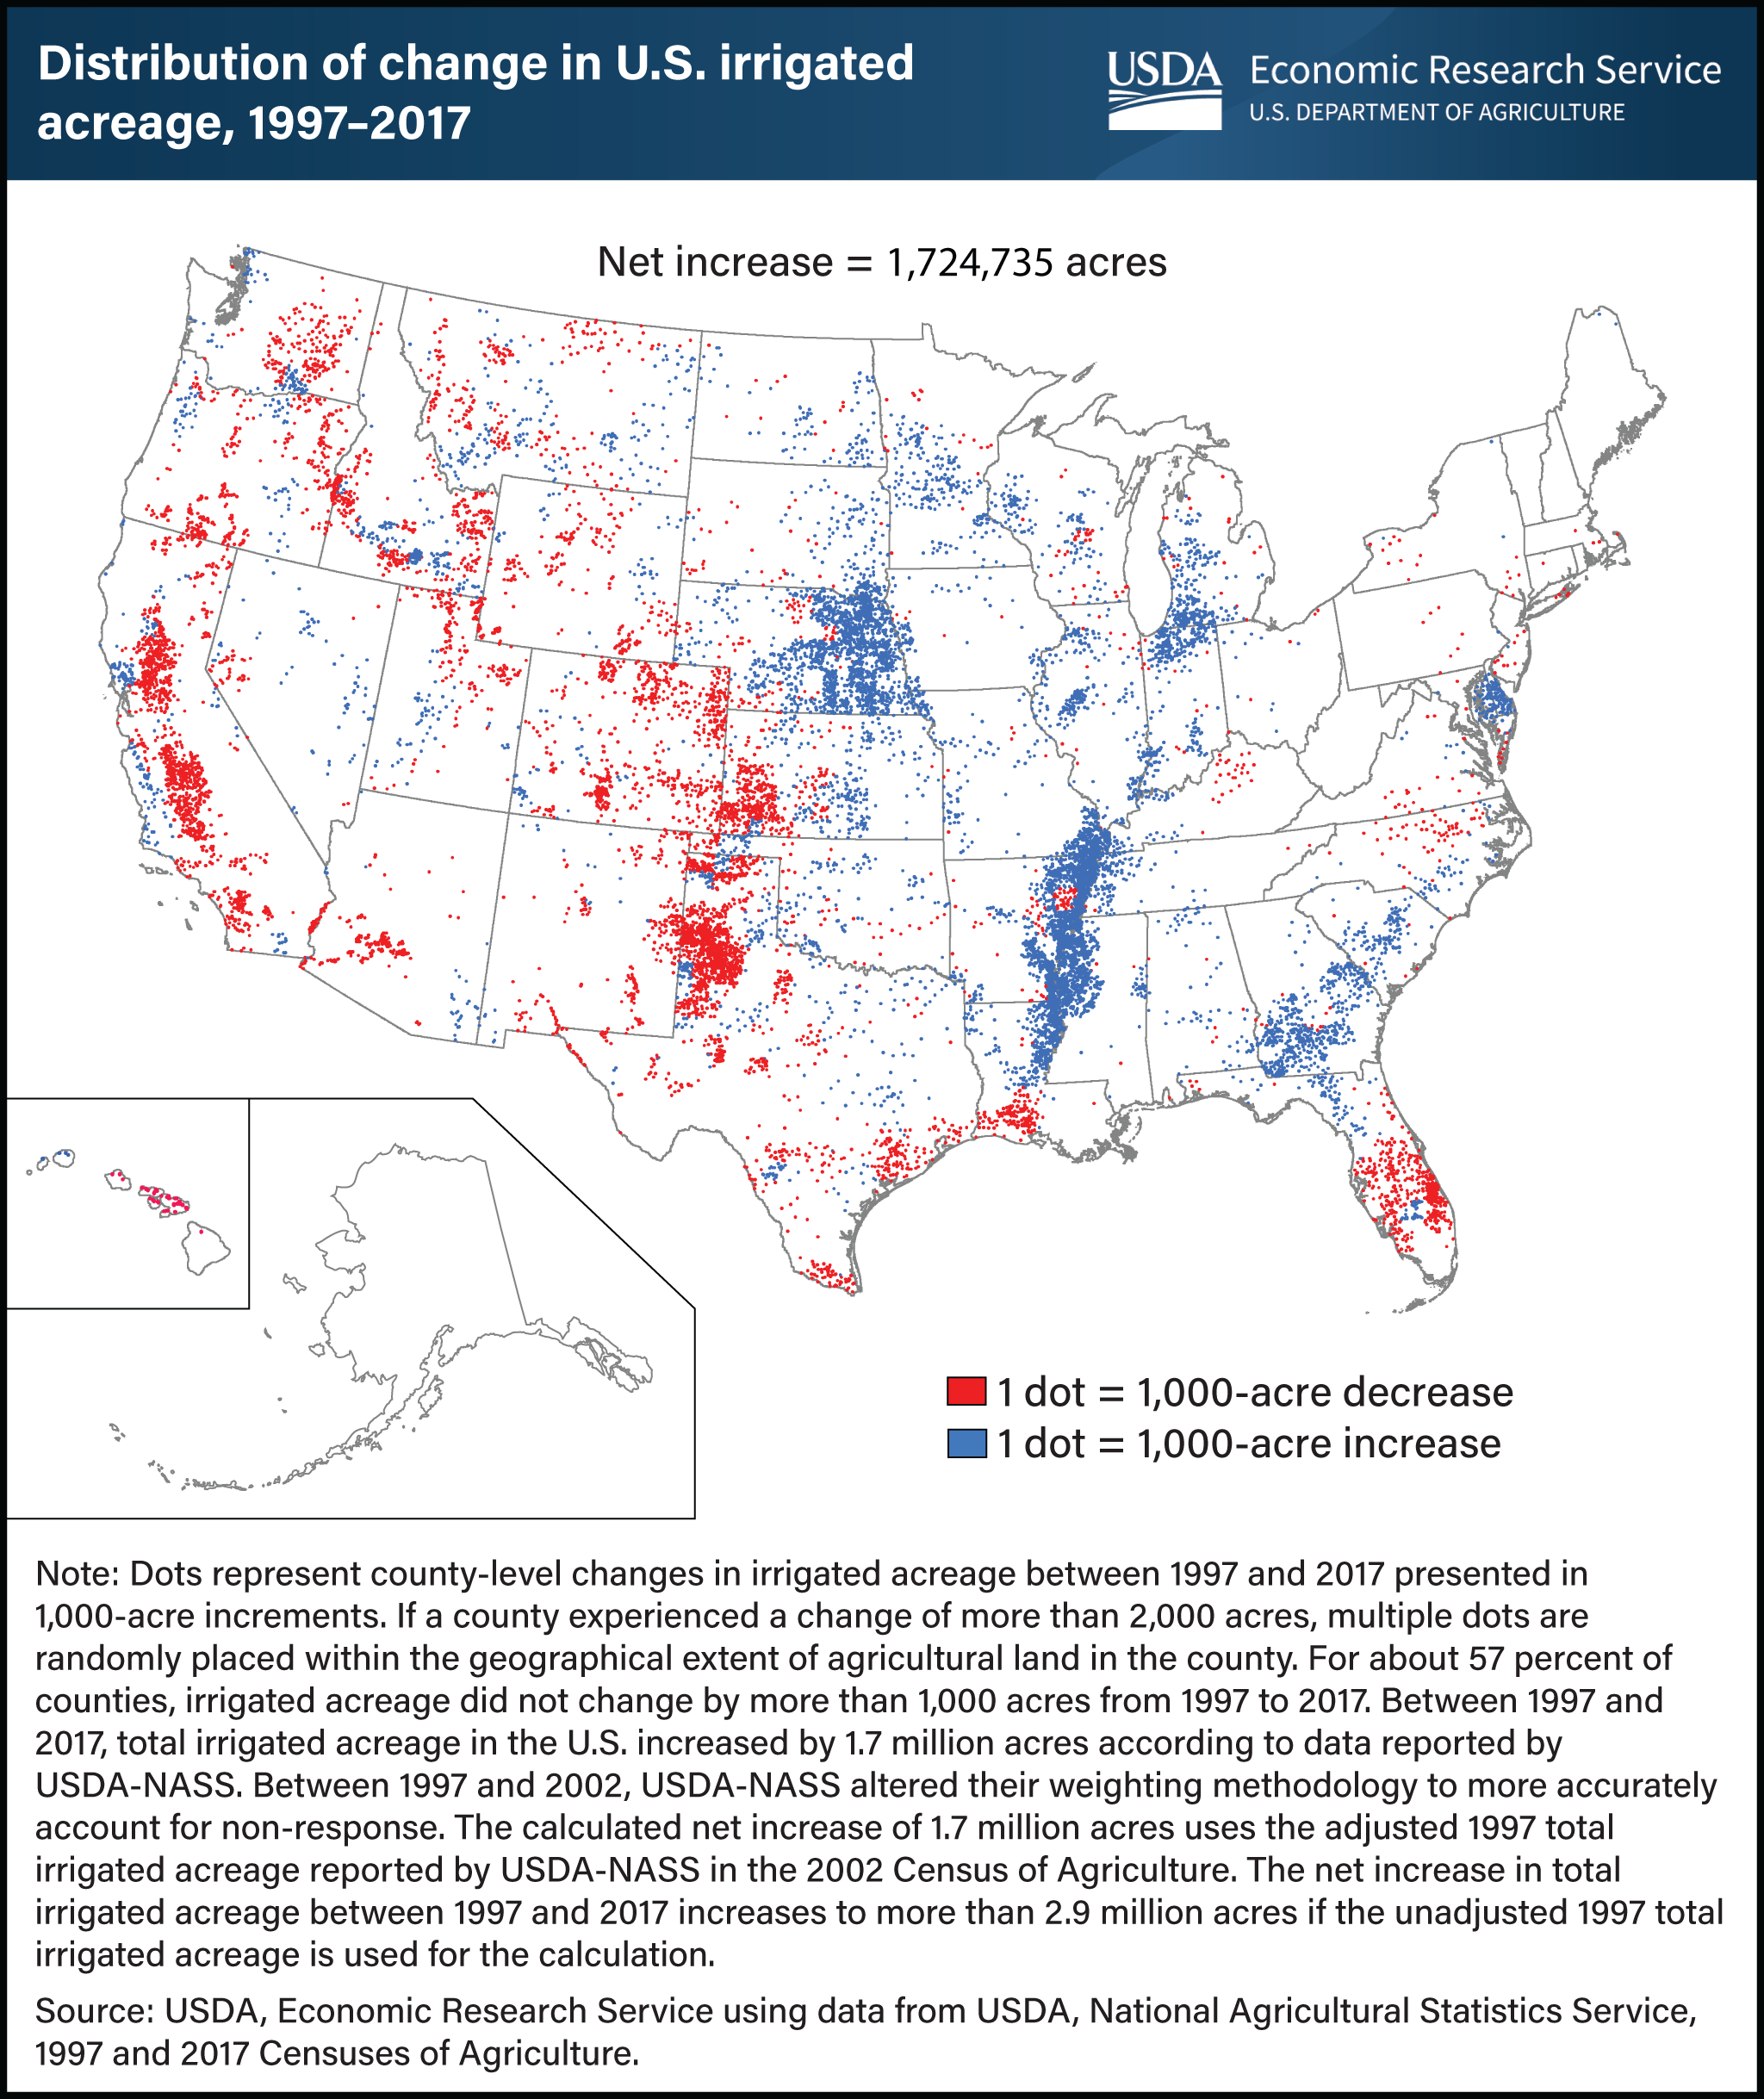
U.S. irrigated agriculture has seen regional changes in the past two decades, influenced by a variety of factors. From 1997 to 2017, total U.S. irrigated agricultural acreage increased by 1.7 million acres. Irrigated acreage grew primarily in the eastern United States, where agriculture production is historically rain-fed, and declined in the West, where a generally arid climate necessitates irrigation for most crops. In the East, increased frequency and severity of drought have driven farmers to move from rain-fed to irrigated production. In the West, farmers have begun to take irrigated land out of production as surface water supplies dry up, and they face increasing competition for water from growing urban centers. This chart was drawn from the USDA, Economic Research Service report Trends in U.S. Irrigated Agriculture: Increasing Resilience Under Water Supply Scarcity, published in December 2021.