
Rural counties dependent on recreation had the most food-away-from-home outlets in 2019
- by Anne T. Byrne
- 9/6/2023
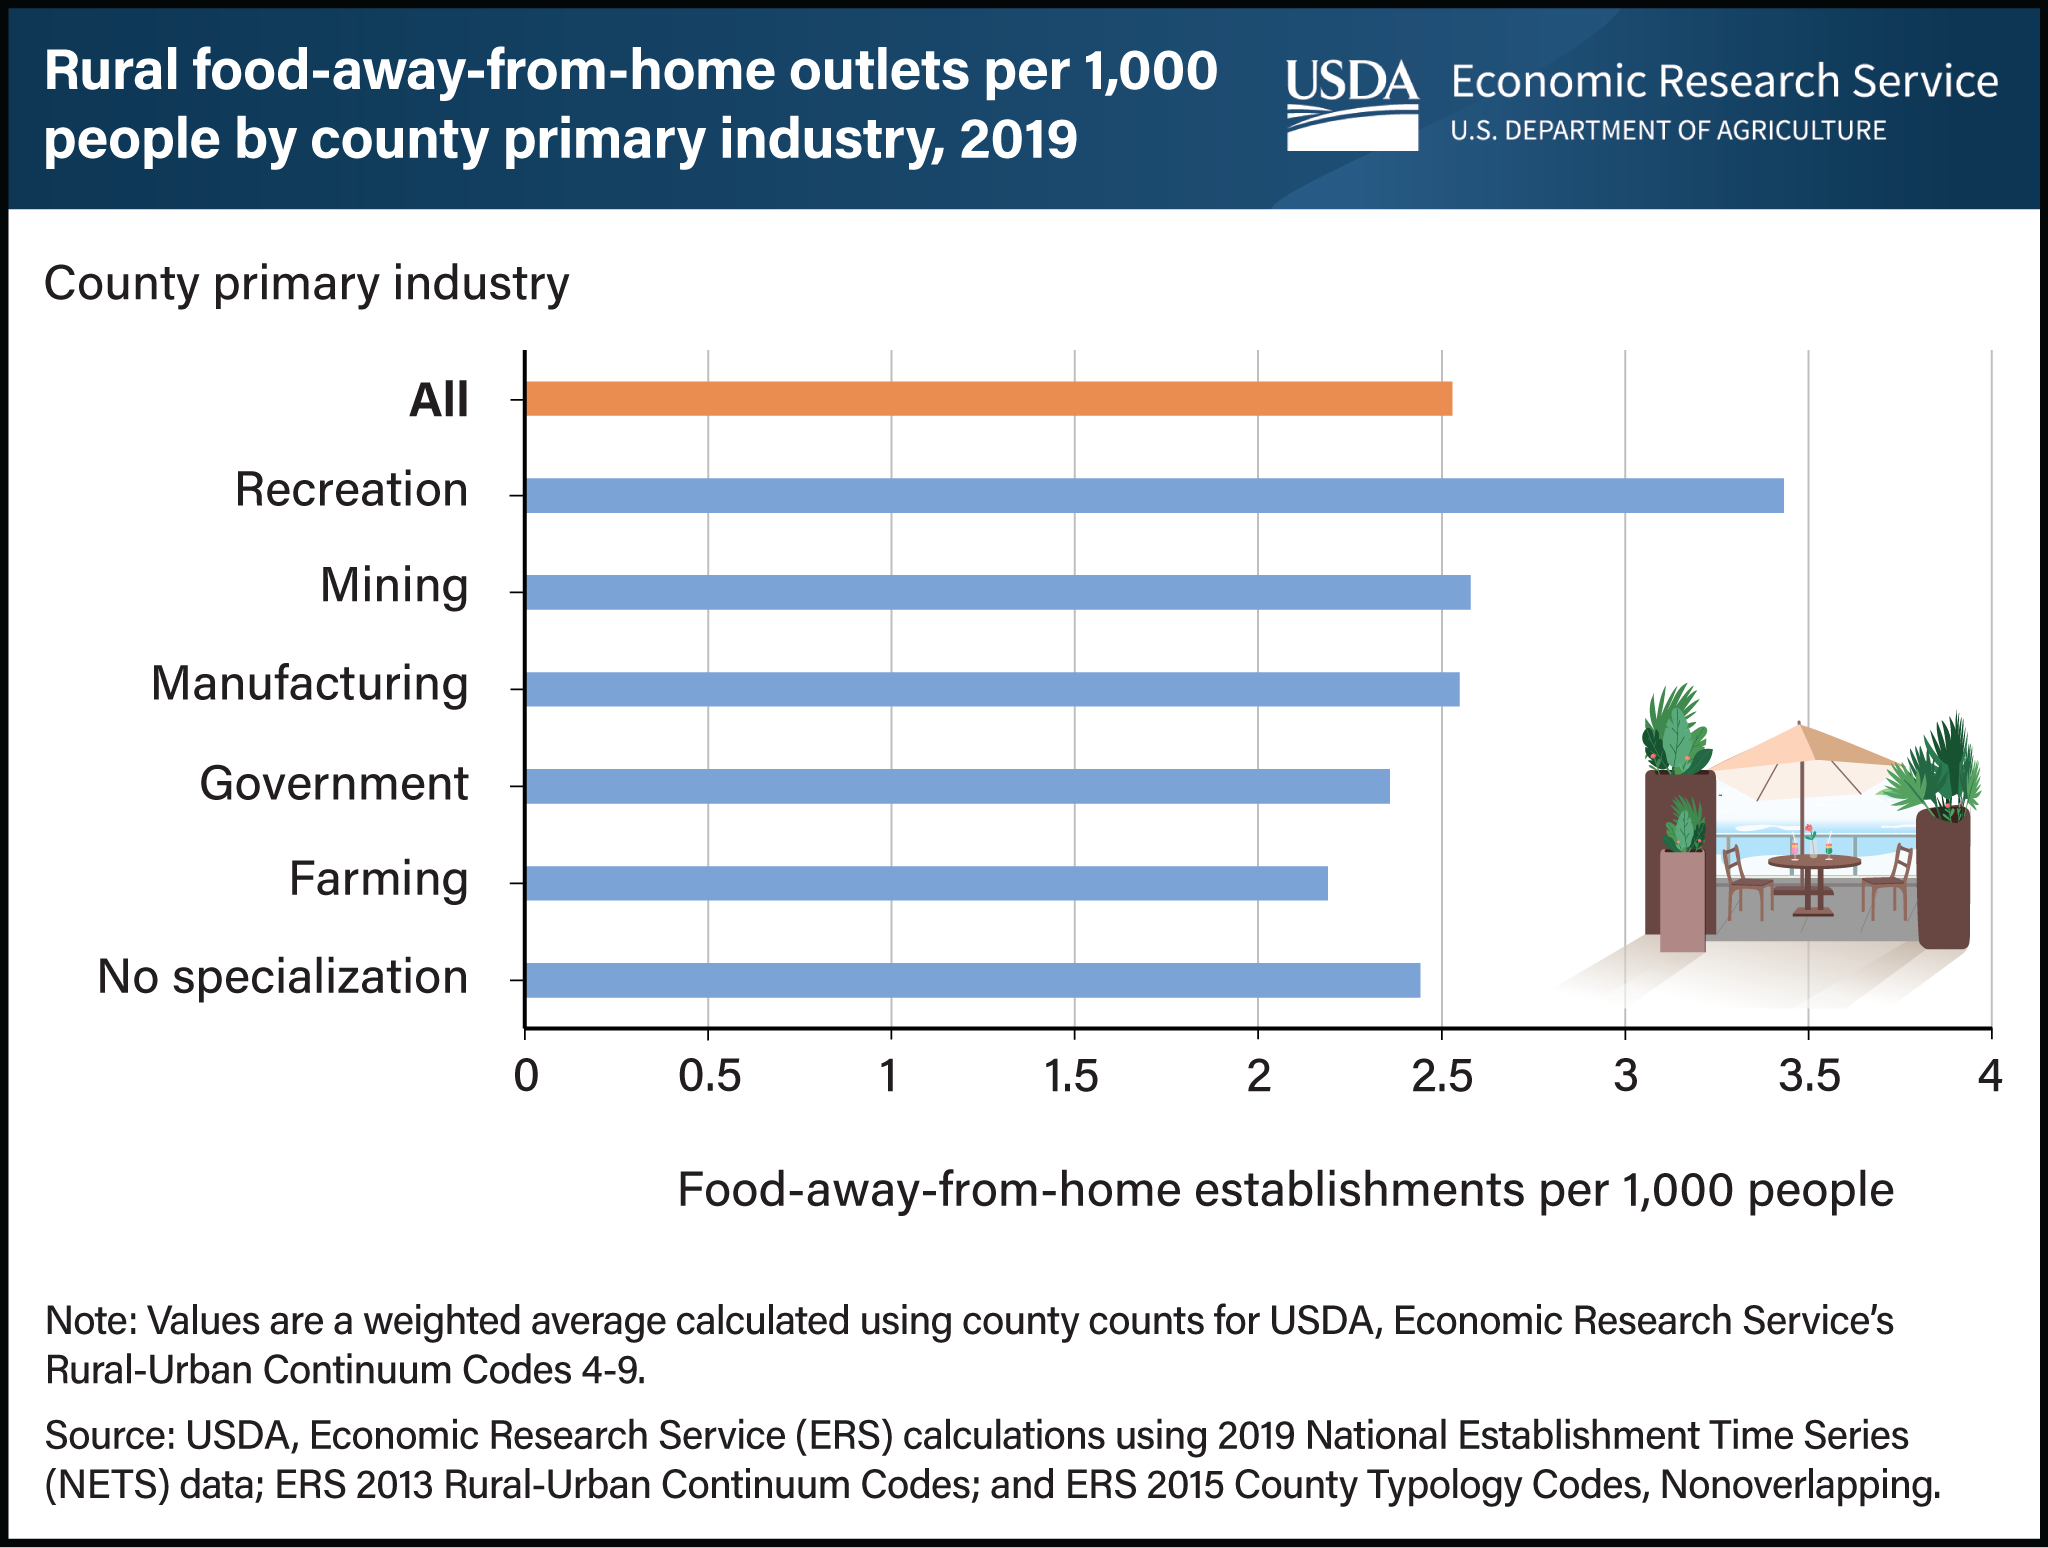
Rural U.S. counties that economically depend on natural amenities, tourism, and recreation generally had more options for dining out per 1,000 people in 2019 than those with other leading industries, such as mining, manufacturing, or farming. Roughly 2,000 U.S. counties were considered rural in 2019, where rural is broadly defined as any area that is nonmetropolitan. About 12 percent of those counties had recreation as their primary industry. Those rural, recreation-dependent counties had nearly 3.5 restaurants and other food-away-from-home (FAFH) establishments per 1,000 people, higher than rural counties dependent on other industries. Other types of rural economies had fewer restaurants and other FAFH outlets per 1,000 people, ranging from 2.2 outlets per 1,000 people in farming-dependent counties to 2.6 in mining-dependent counties. Metropolitan counties had average densities between 1.4 and 3.1 FAFH establishments per capita. This chart appears in the ERS Amber Waves article, Among Rural U.S. Counties, Those With Recreation-Dependent Economies Had Most Options Per Capita for Dining Out in 2019, published in August 2023.