
Food services industry share of food dollar shrank in 2020 after 8 consecutive years of growth
- by James Chandler Zachary and Quinton Baker
- 4/20/2022
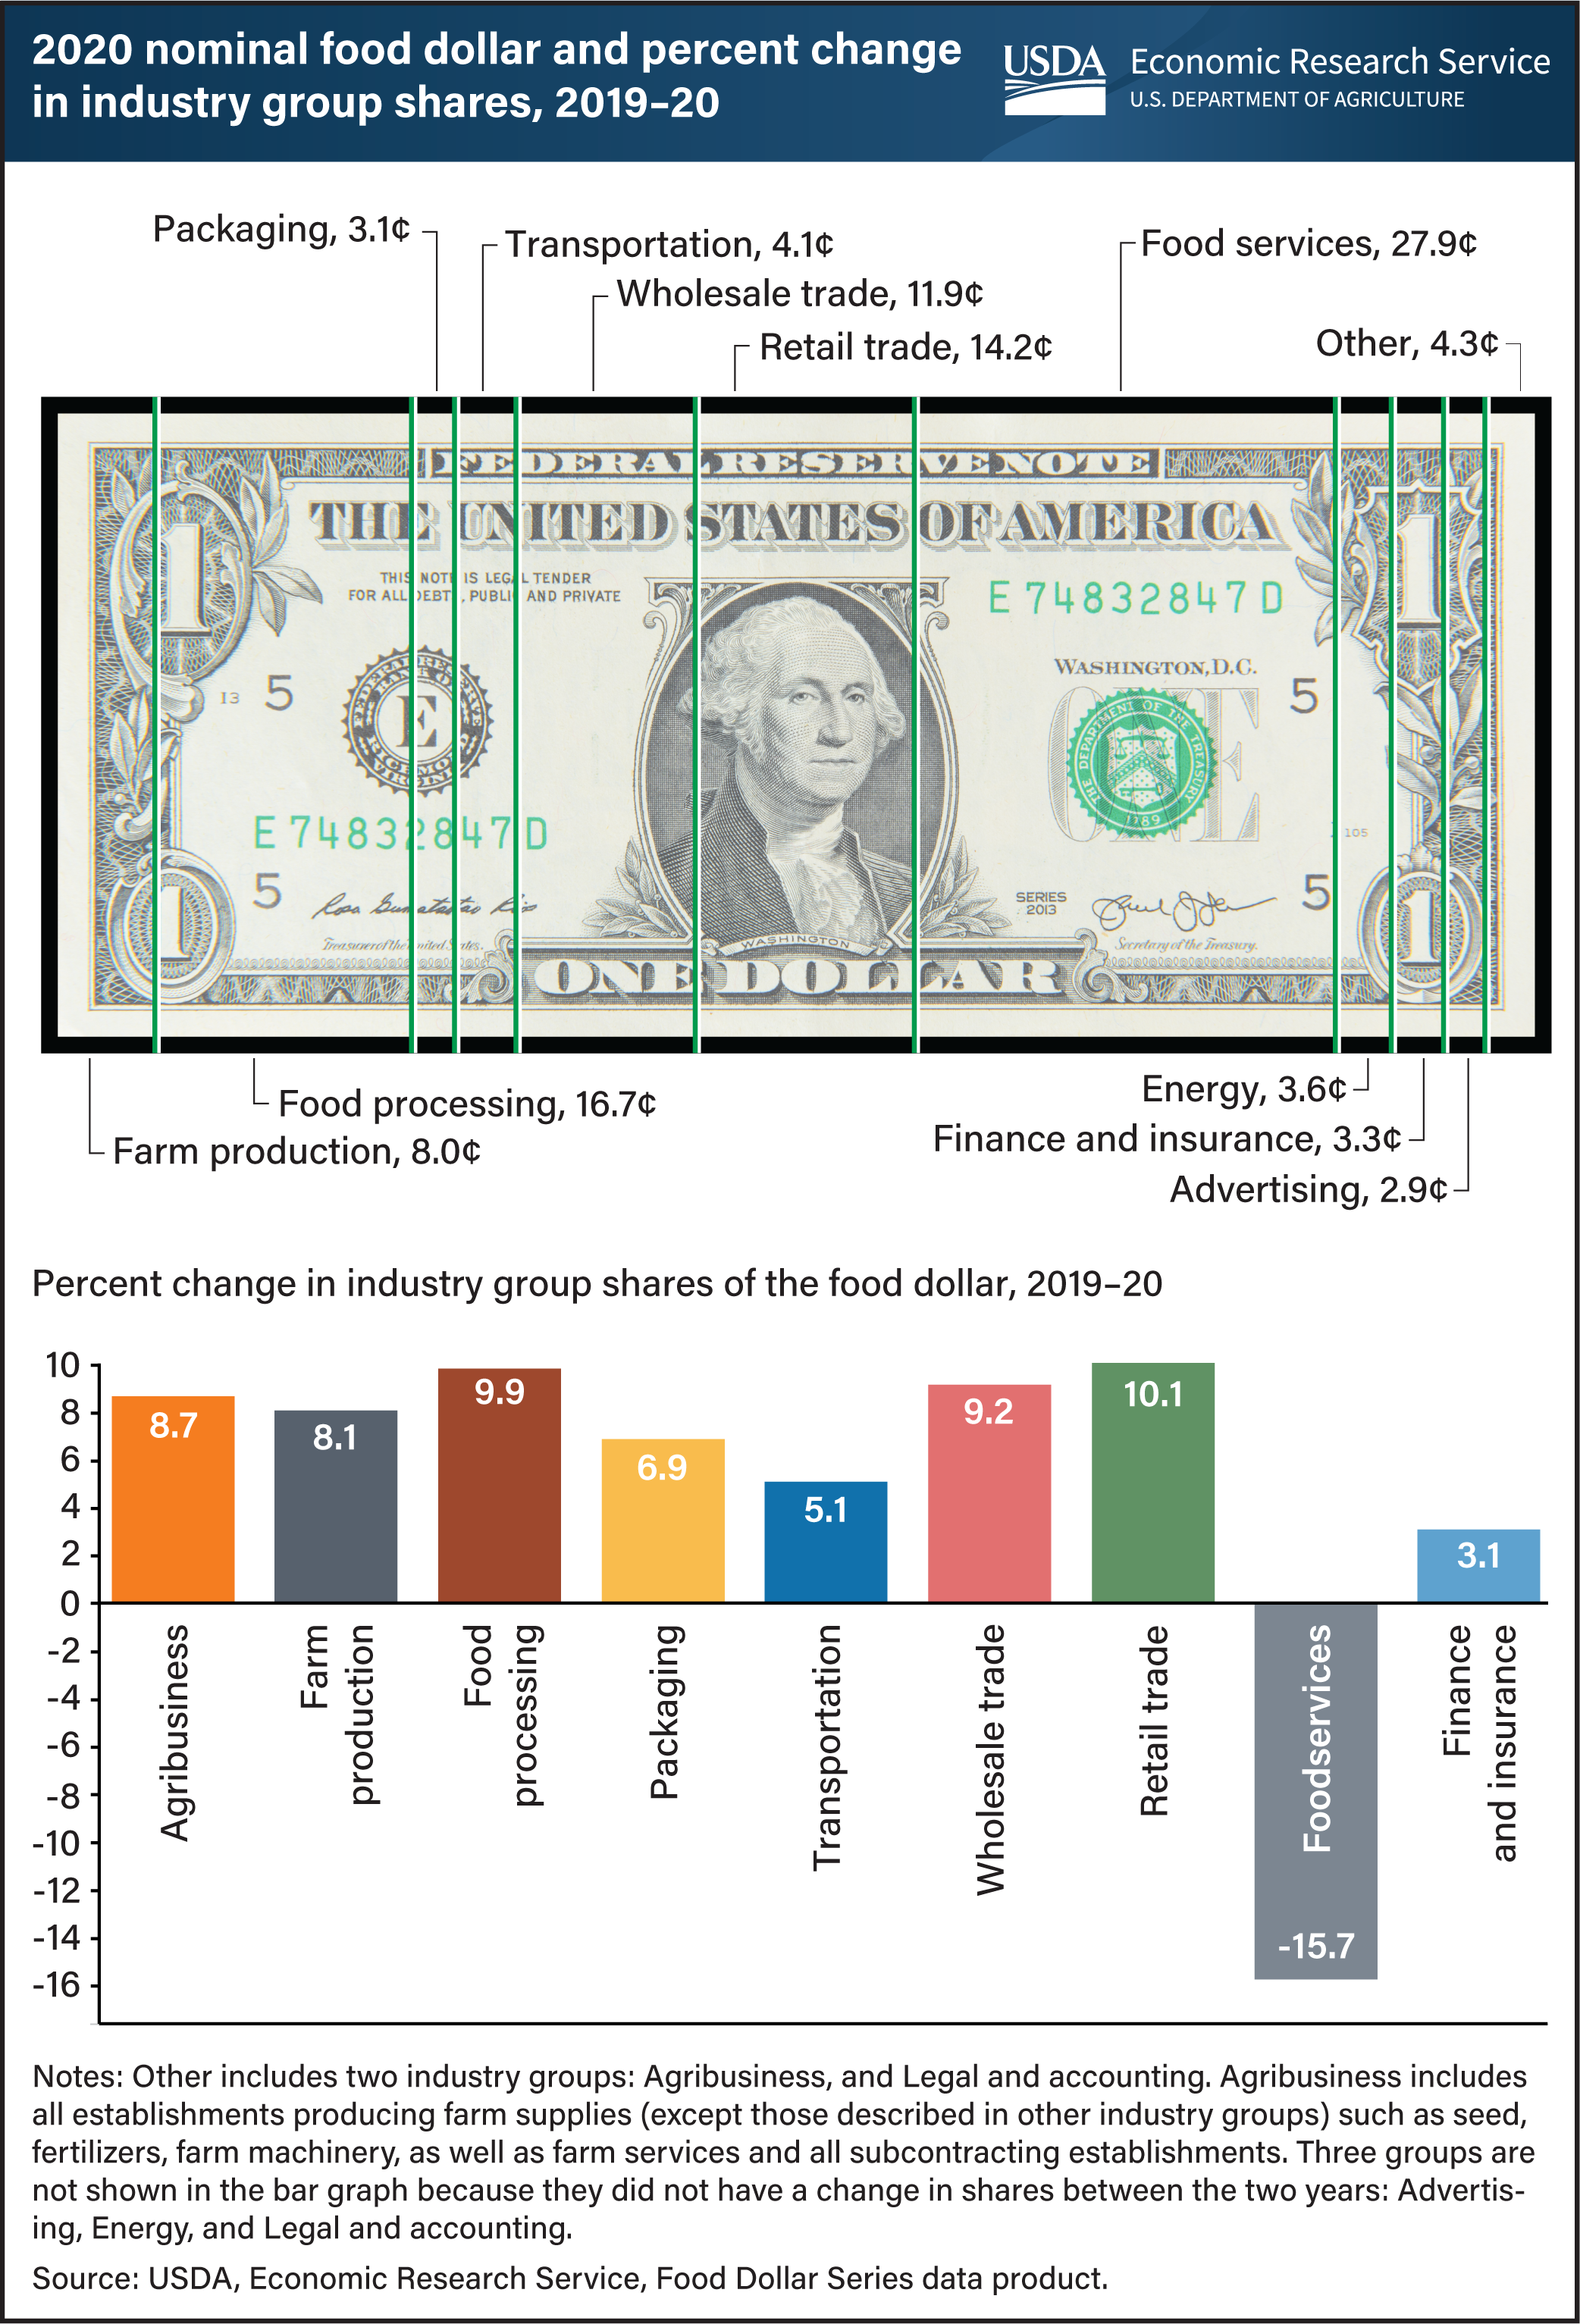
In 2020, restaurants and other eating-out establishments received 27.9 cents of an average dollar spent on domestically produced food, called the food dollar. This marks a 15.7-percent drop from 33.1 cents in 2019 as consumers reduced food-away-from-home purchases and increased purchases from food-at-home markets at the onset of the Coronavirus (COVID-19) pandemic. All other industry group shares expanded except for three that had no annual change in 2020: Advertising, Energy, and Legal and accounting. Notably, the Retail trade (10.1 percent), Wholesale trade (9.2 percent), and Packaging (6.9 percent) shares increased by the largest percentages for their respective industry group since the data series began. The USDA Economic Research Service’s (ERS) annual Food Dollar Series provides insight into the industries that make up the U.S. food system and their contributions to total U.S. spending on domestically produced food. ERS uses input-output analysis to calculate the cost contributions from 12 industry groups in the food supply chain. Annual shifts in the food dollar shares between industry groups occur for a variety of reasons, including changes in the mix of foods consumers buy, costs of materials, ingredients, and other inputs, as well as changes in the balance of food at home and away from home. The industry group shares dollar chart is available for 1993 to 2020 and can be found in ERS’s Food Dollar Series data product, updated on March 17, 2022.