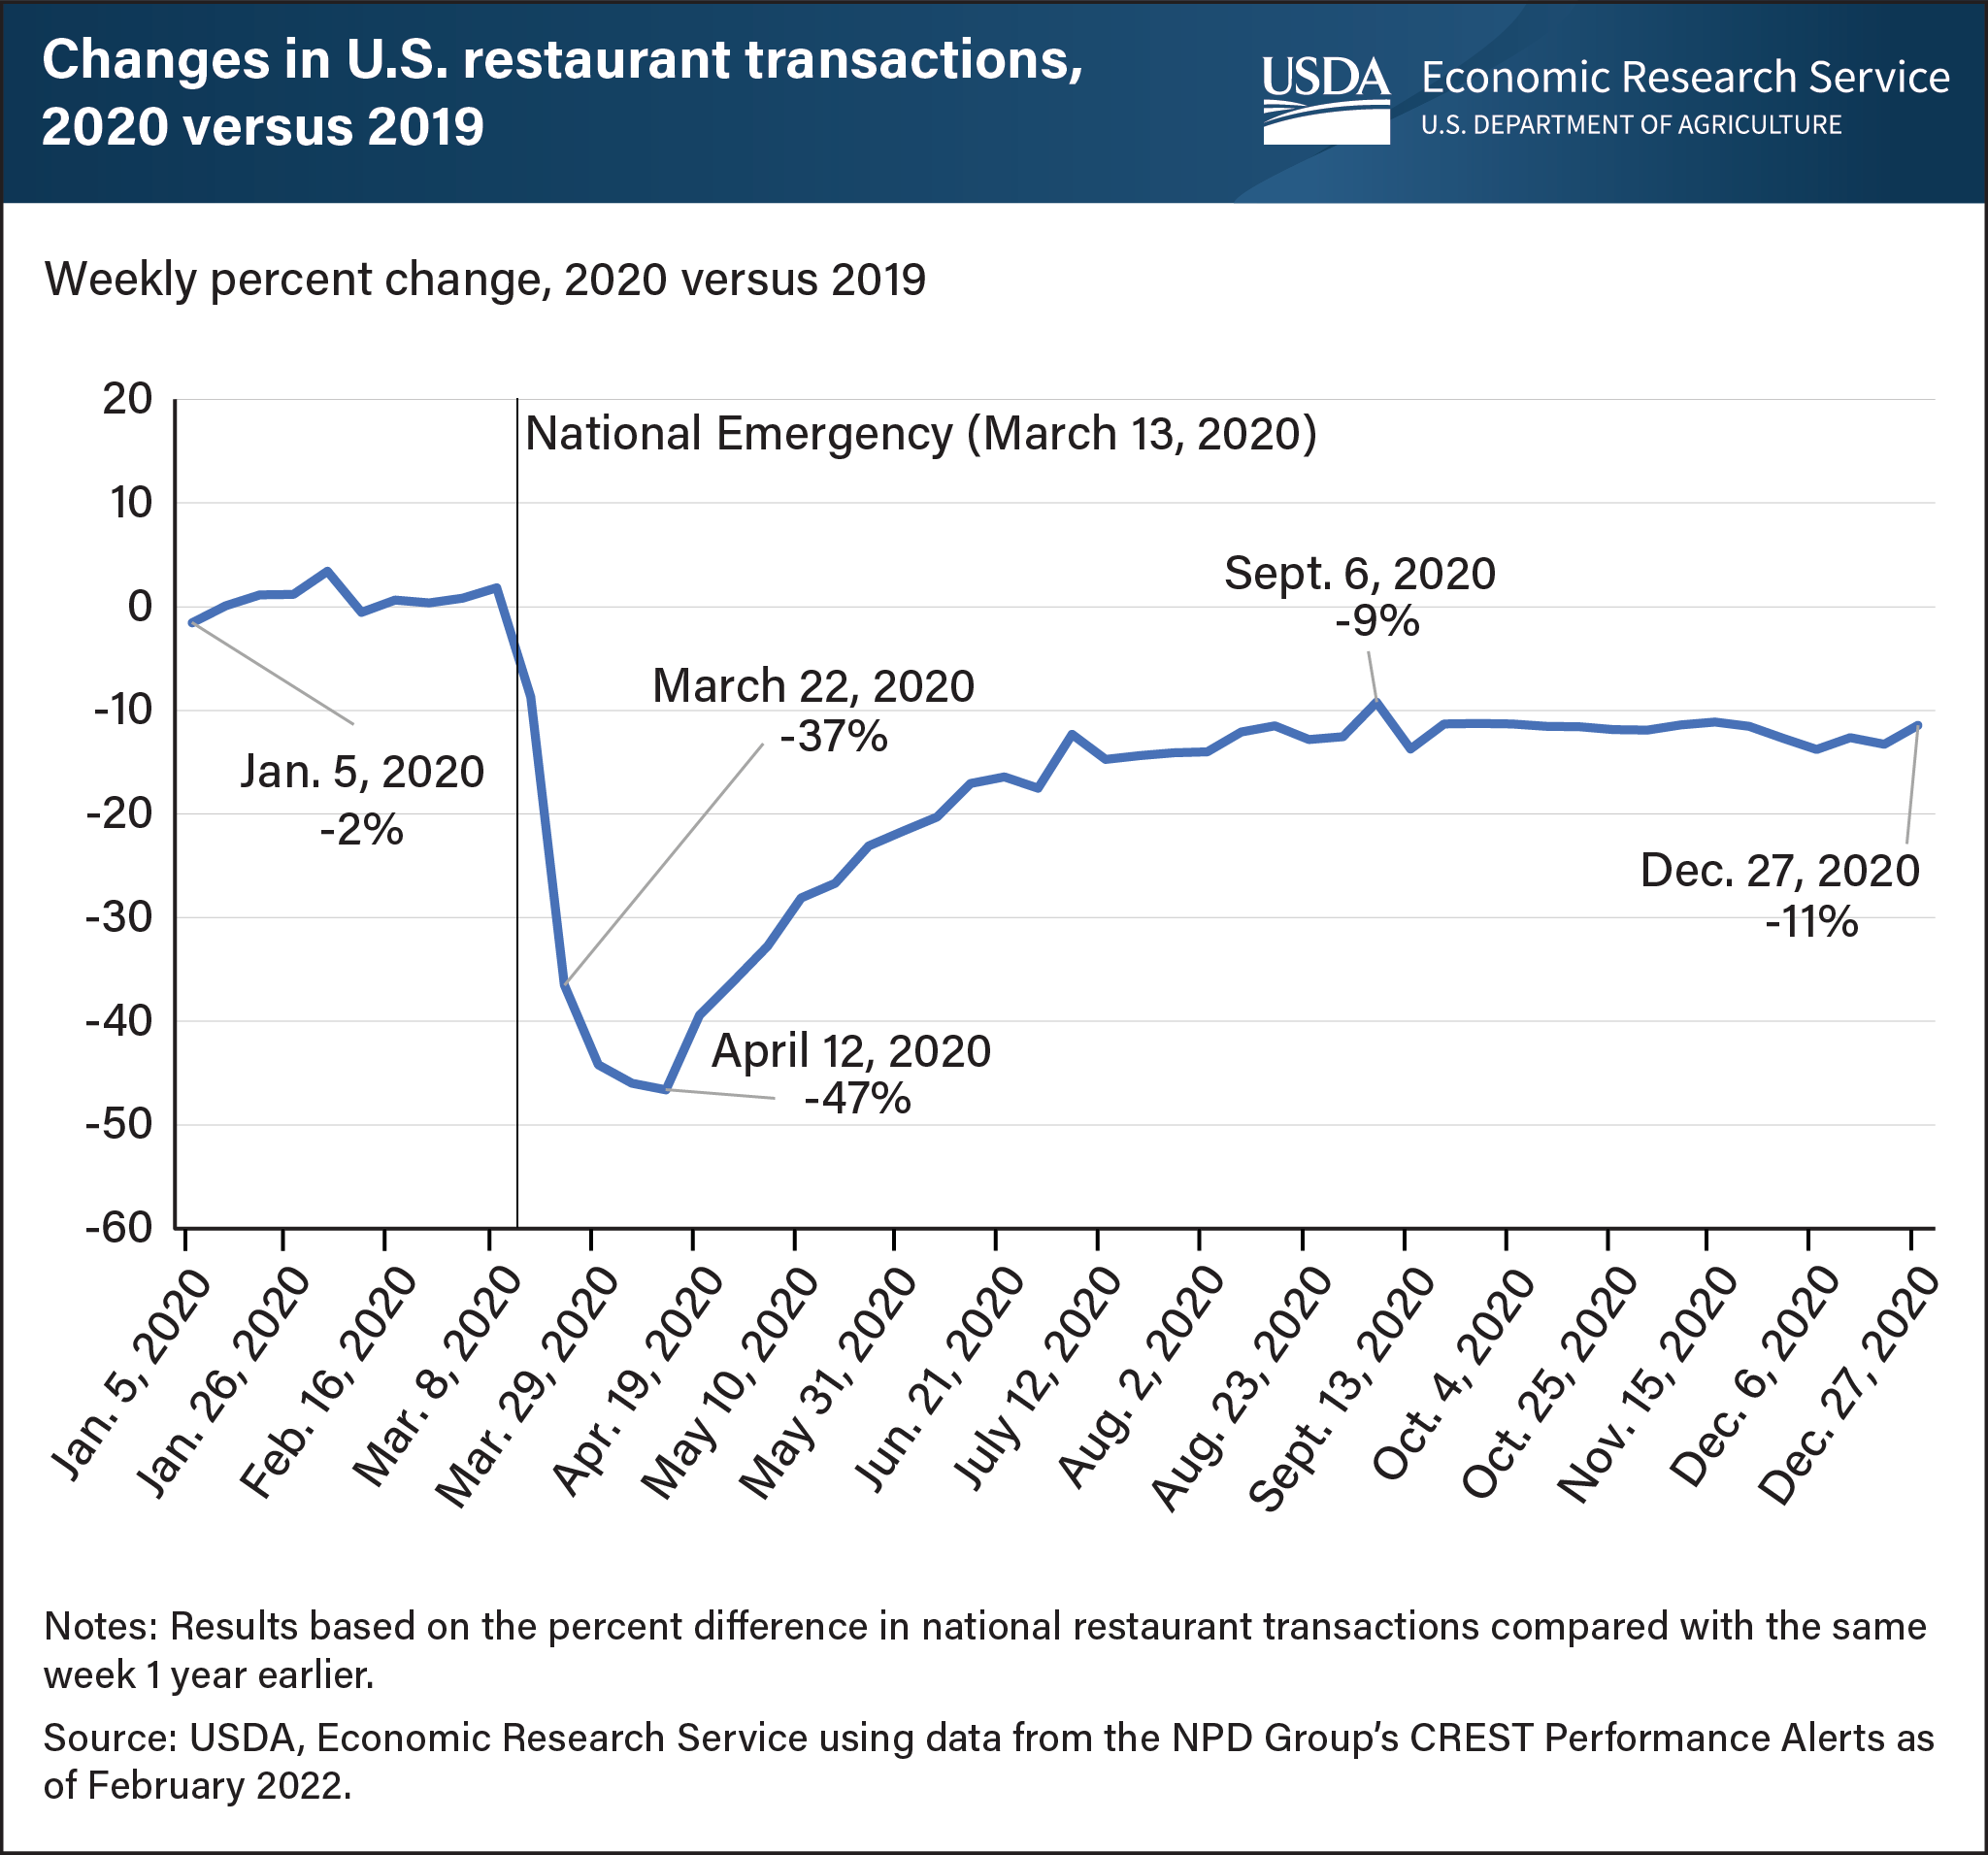
Restaurant transactions fell 47 percent in April 2020, compared with a year earlier, after onset of COVID-19 pandemic
- by Keenan Marchesi
- 3/28/2022

On March 13, 2020, the Federal government declared a national emergency in response to the Coronavirus (COVID-19) pandemic. In response, many State and local governments implemented social distancing measures, stay-at-home orders, and the mandatory closure of businesses in high-risk industries. Restaurants were often included in these mandates, which forced many to close their dining rooms, if not the entire business, sharply reducing restaurant visits across the country. USDA, Economic Research Service (ERS) researchers recently examined the weekly percent change in restaurant transactions relative to a year prior to show how visits changed during the first few months of the pandemic. During the first full week after the national emergency declaration, there were 37 percent fewer restaurant transactions than the same week in 2019. The largest year-to-year changes occurred three weeks later, when transactions were down 47 percent relative to the year before. By the end of the year, weekly transactions remained 11 percent lower than they had been in 2019. This chart is based on a chart in the ERS’s COVID-19 Working Paper: The Impact of COVID-19 Pandemic on Food-Away-From-Home Spending, released March 9, 2022.

