
Food services industry share of the food dollar increased in 2019 for eighth consecutive year
- by Quinton Baker
- 5/17/2021
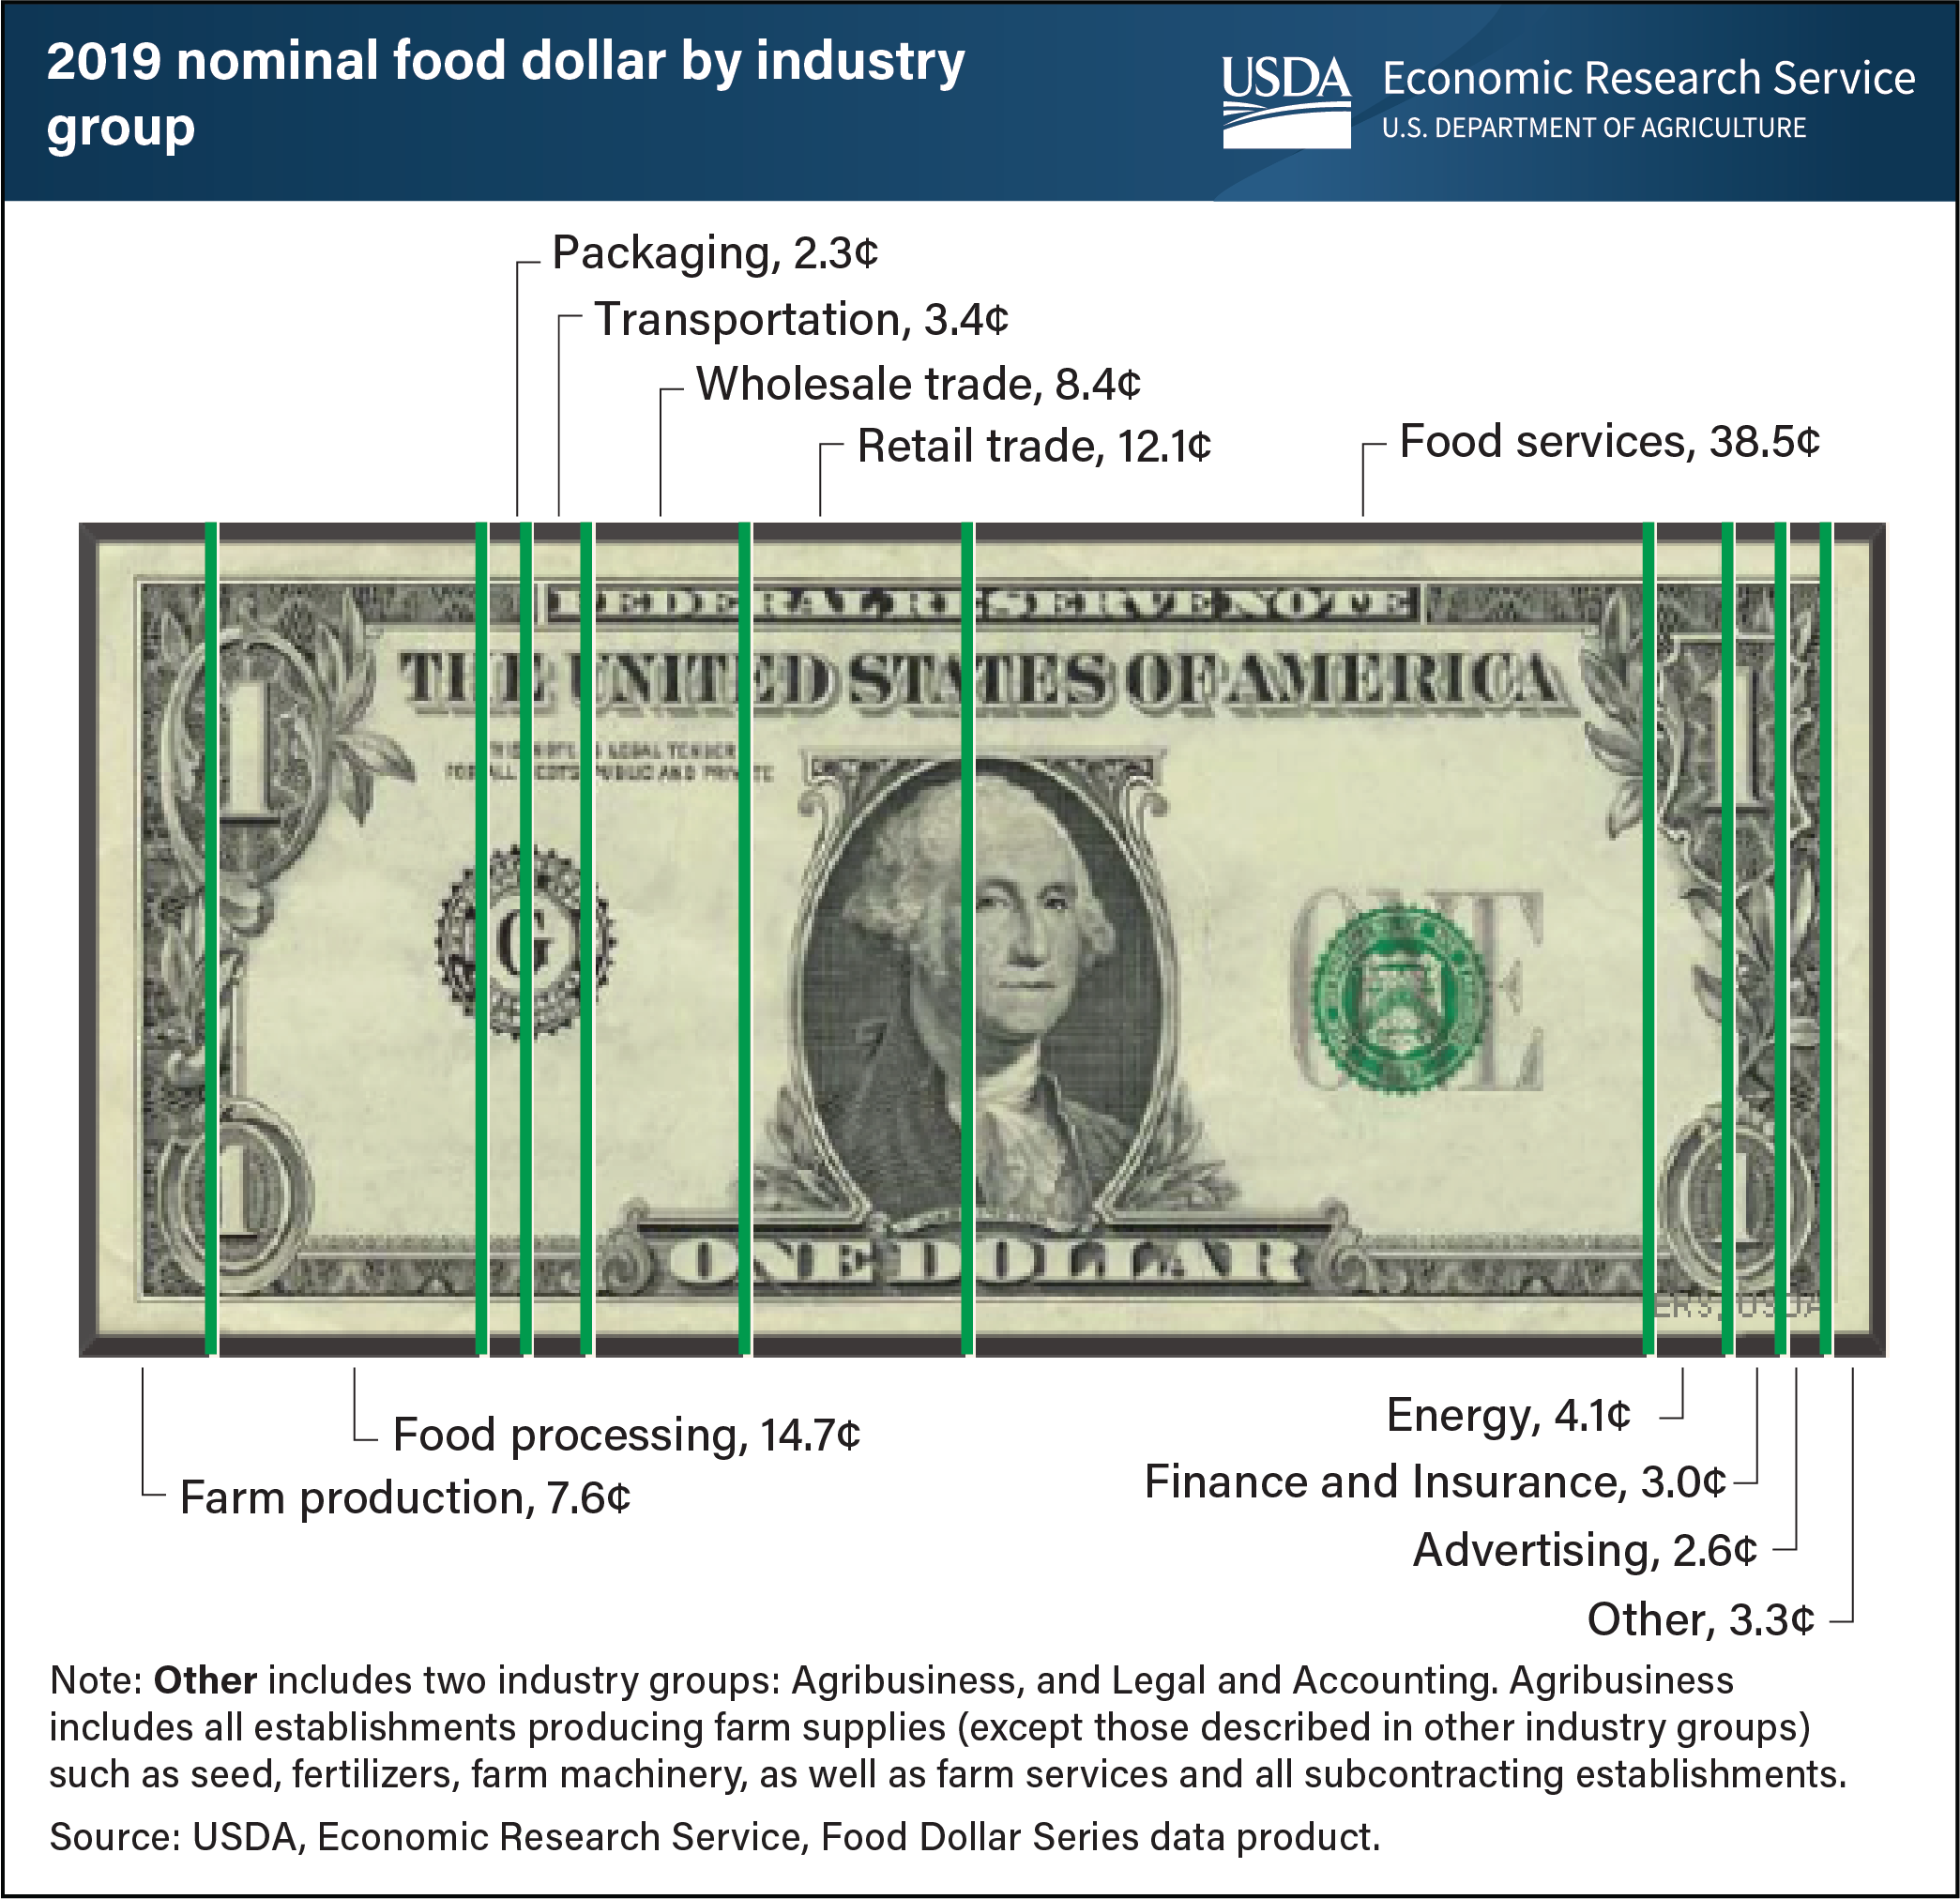
In 2019, restaurants and other eating places claimed 38.5 cents of the average U.S. food dollar, continuing a steady climb since 2009, when the food services industry’s share was 29.6 cents. Farm production was the only other industry with a rising food dollar share in 2019, up slightly to 7.6 cents from its 25-year low of 7.4 cents in 2018. The proportion of the food dollar was the smallest since 1993 for several industries in 2019: agribusiness (such as fertilizer and farm services), food processing, packaging, wholesale trade and retail trade. The 2019 food dollar reflects conditions before the COVID-19 pandemic. ERS’s annual Food Dollar Series provides insight into the industries that make up the U.S. food system and their contributions to total U.S. spending on domestically produced food. ERS uses input-output analysis to calculate the cost contributions from 12 industry groups in the food supply chain. Annual shifts in the food dollar shares between industry groups occur for a variety of reasons, including changes in the mix of foods consumer buy, costs of materials, ingredients, and other inputs, as well as changes in the balance of food at home and away from home. This chart is available for the years 1993 to 2019, and can be found in ERS’s Food Dollar Series data product, updated on March 17, 2021.