
Between 2010 and 2015, 30 States saw an increase in the share of residents living in low-income areas with low access to food stores
- by Alana Rhone
- 3/11/2020
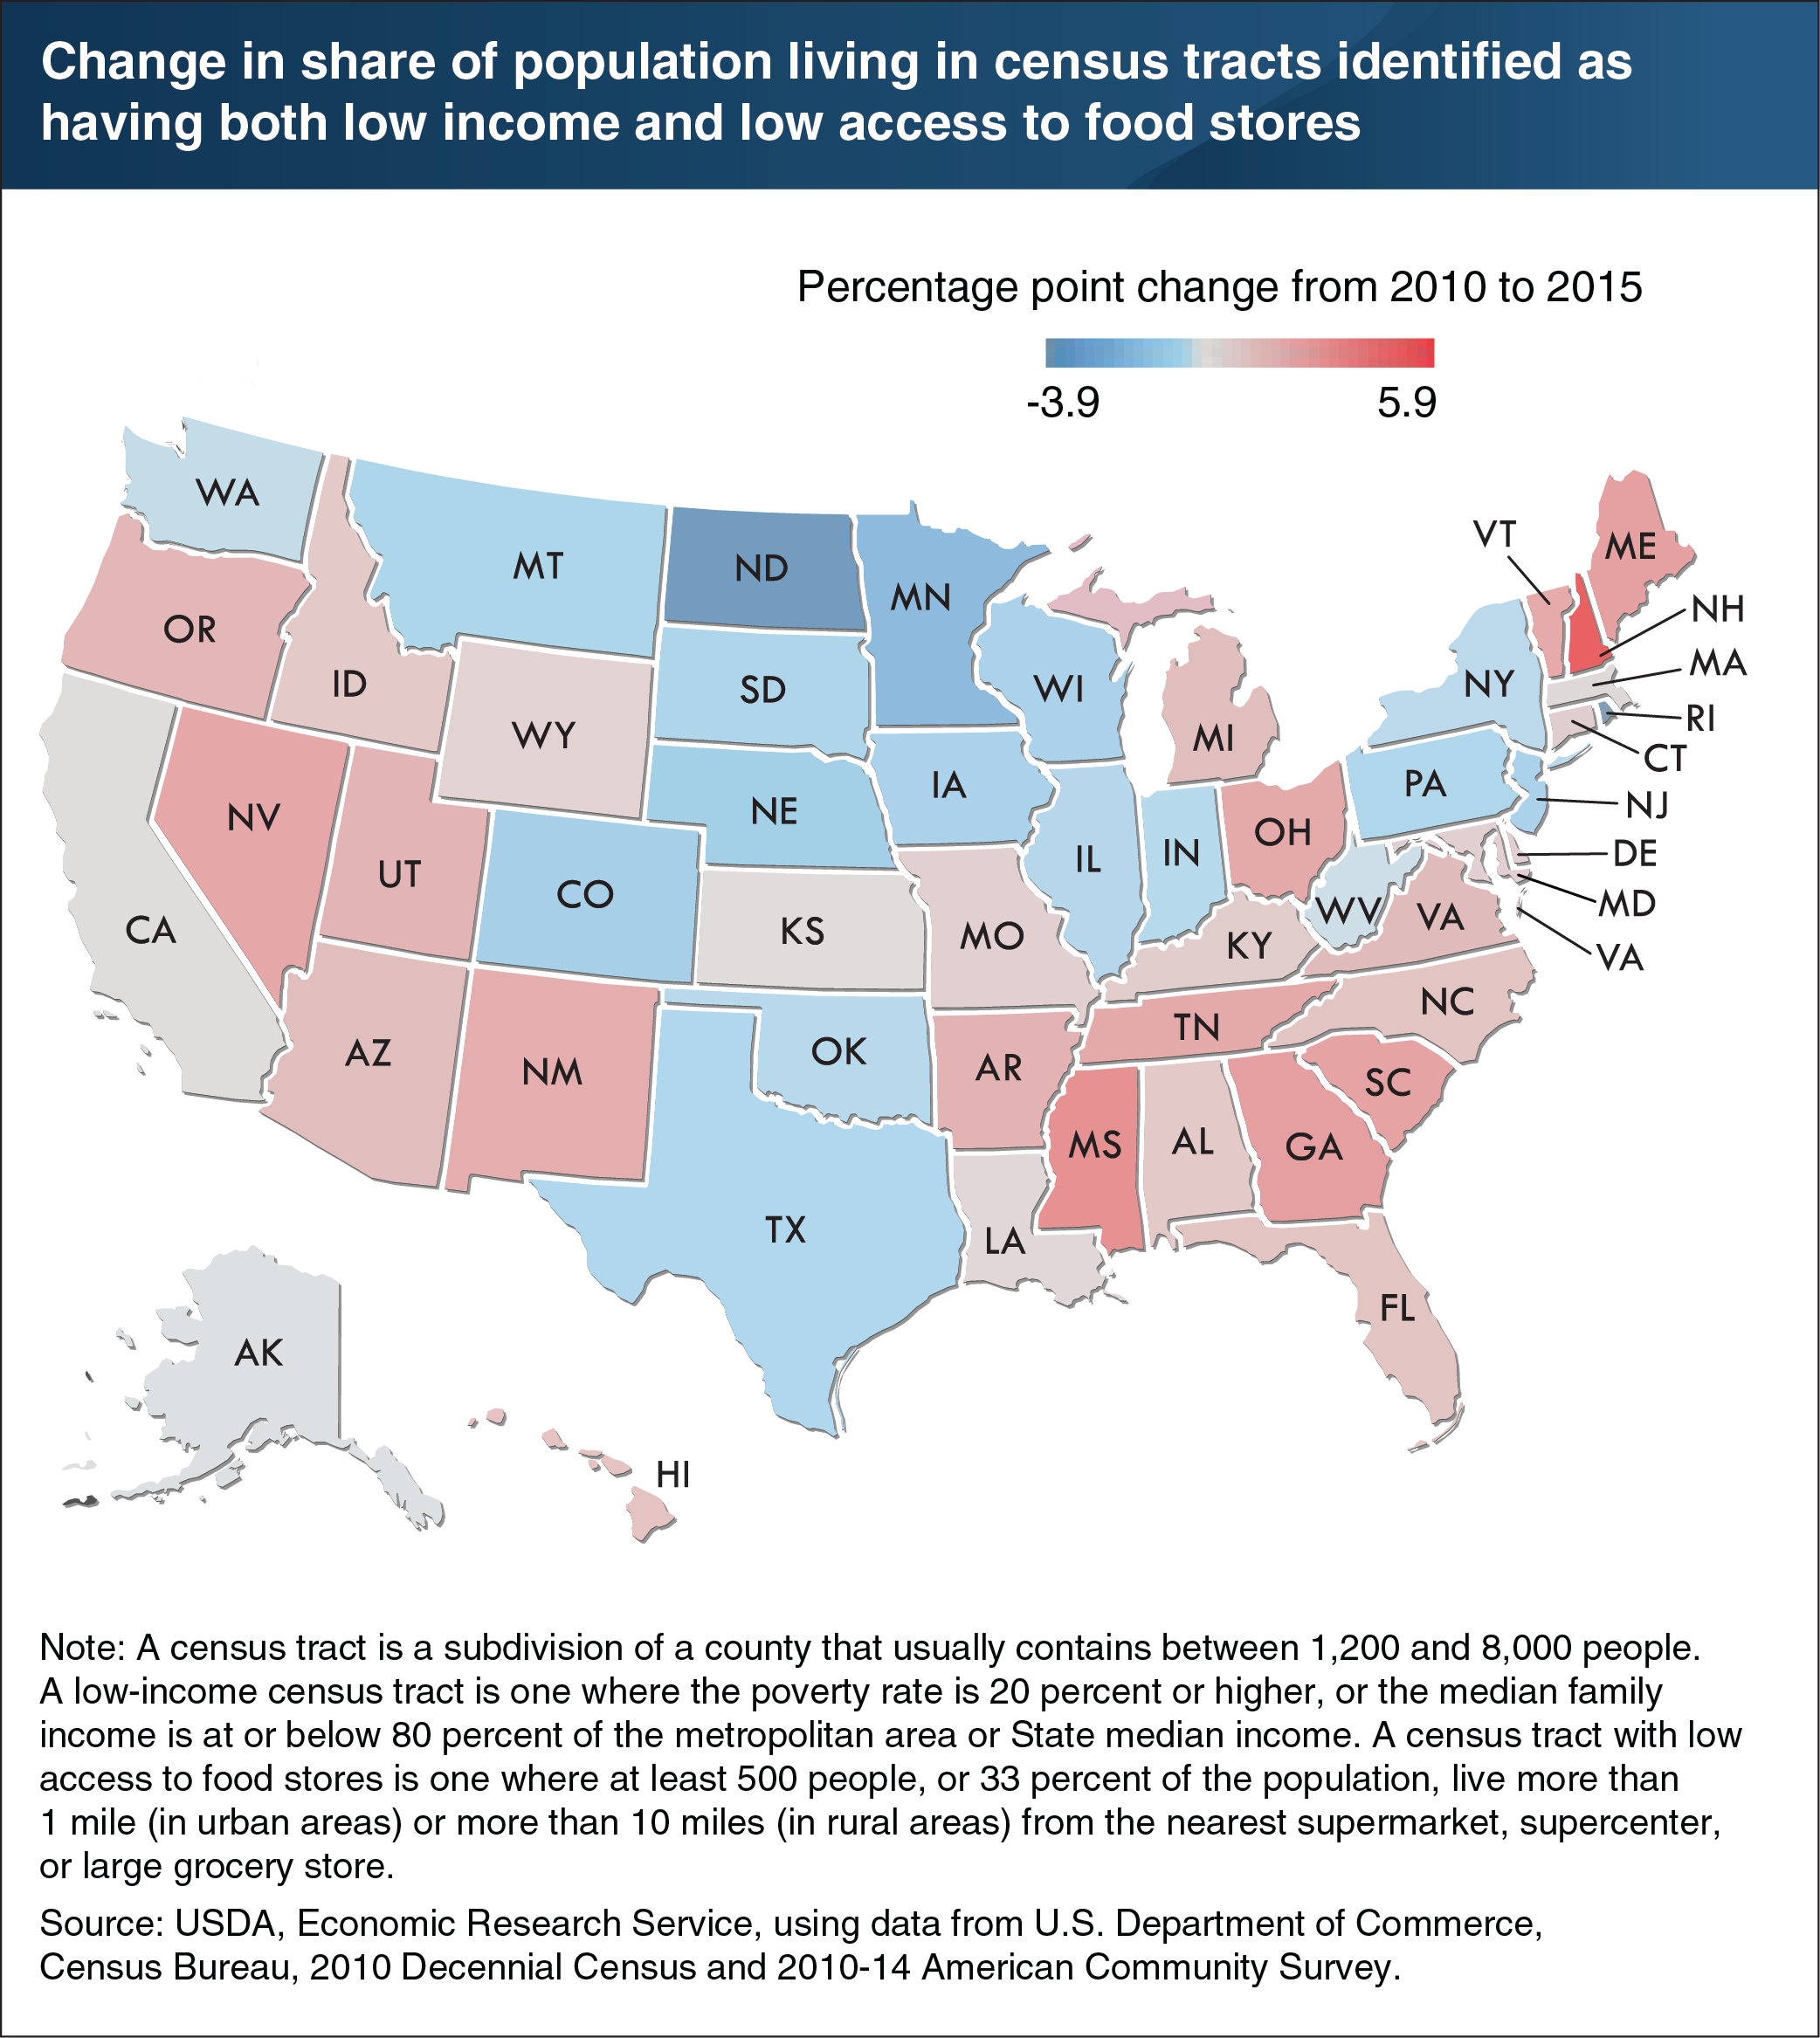
Obtaining affordable and nutritious food can be difficult for people who live in low-income census tracts with low access to supermarkets, supercenters, or large grocery stores—called low-income, low-access, or LILA, census tracts (see chart for LILA definitions). Economic Research Service (ERS) researchers examined changes from 2010 to 2015 in the number of people living in LILA census tracts by State. Over this time, 30 States saw an increase in the share of their residents living in LILA tracts. In most cases, these increases resulted from more census tracts meeting the definition of low income after the Great Recession of 2007-09. New Hampshire had the greatest percentage-point increase, growing from 9 to 15 percent, followed by Mississippi (from 27 to 30 percent) and Georgia (from 20 to 23 percent). Between 2010 and 2015, 20 States plus the District of Columbia saw a decrease in the share of their populations living in LILA tracts. The share of residents living in LILA tracts in North Dakota fell the most—from 12 to 8 percent—followed by the District of Columbia (from 6 to 3 percent) and Rhode Island (from 8 to 5 percent). This chart appears in the ERS data visualization, “State by State estimates of low income & low access (LILA) populations.”
We’d welcome your feedback!
Would you be willing to answer a few quick questions about your experience?