
USDA’s Purchase to Plate Price Tool estimates food cost for national food intake data
- by Andrea Carlson and Elina T. Page
- 9/18/2020
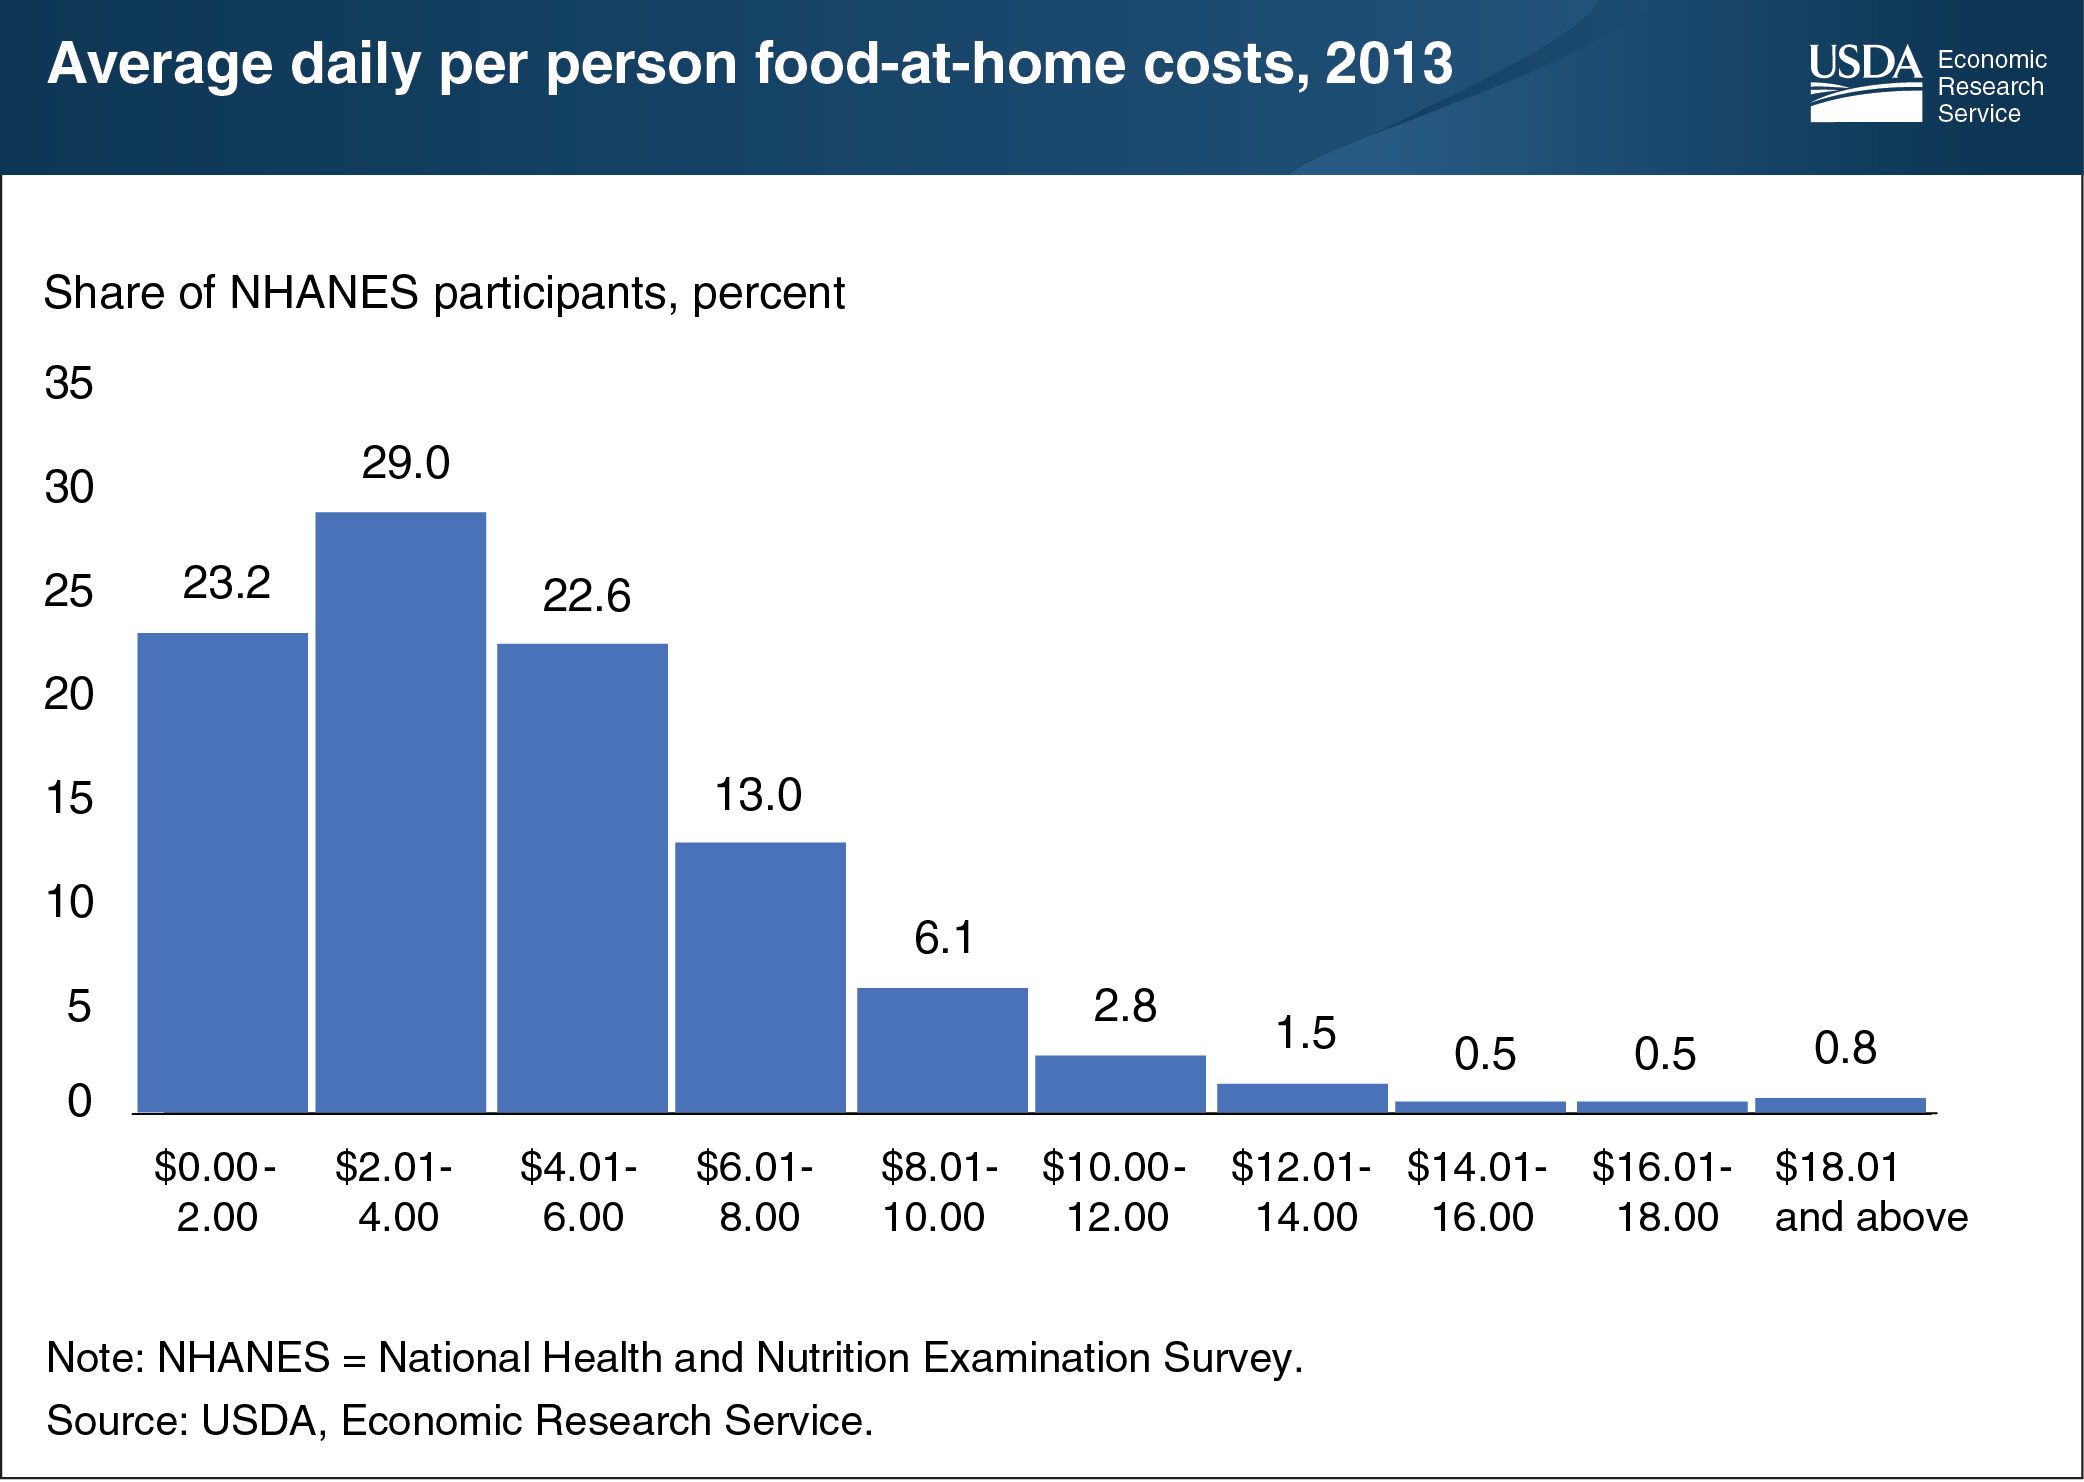
Researchers from two USDA agencies—the Economic Research Service (ERS) and the Center for Nutrition Policy and Promotion—recently collaborated on a project to help USDA update its Thrifty Food Plan, as mandated by the 2018 Farm Bill. Benefits for the Supplemental Nutrition Assistance Program (SNAP) are determined by the cost of the basket of foods that make up the Thrifty Food Plan. The collaborative project, the Purchase to Plate Price Tool, used a complex matching algorithm to link a USDA recipe database and 2013 grocery store sales data to estimate the retail cost of the foods participants reported eating in the 2011-12 National Health and Nutrition Examination Survey. These estimated costs can be used for a variety of purposes including to calculate daily at-home food costs for Americans—in general or by demographic subgroups. In this analysis, at-home foods are foods and beverages prepared at home from ingredients or ready-to-eat foods purchased at retail stores, such as supermarkets, supercenters, and convenience stores. The researchers found that across all ages, including both male and female survey participants, the average daily cost for at-home food was $4.54 per person in 2013. For 75 percent of the participants, the daily cost was $6.00 or less. More recent consumption and sales data will be incorporated into the Purchase to Price Plate Tool to support USDA’s update of the Thrifty Food Plan. The data for this chart are from the ERS report, Estimating Prices for Foods in the National Health and Nutrition Examination Survey: The Purchase to Plate Price Tool, September 2020.