
Smaller farms often rely on the principal operators and their spouses for labor, while larger farms rely on hired labor
- by Marcelo Castillo and James M. MacDonald
- 7/8/2020
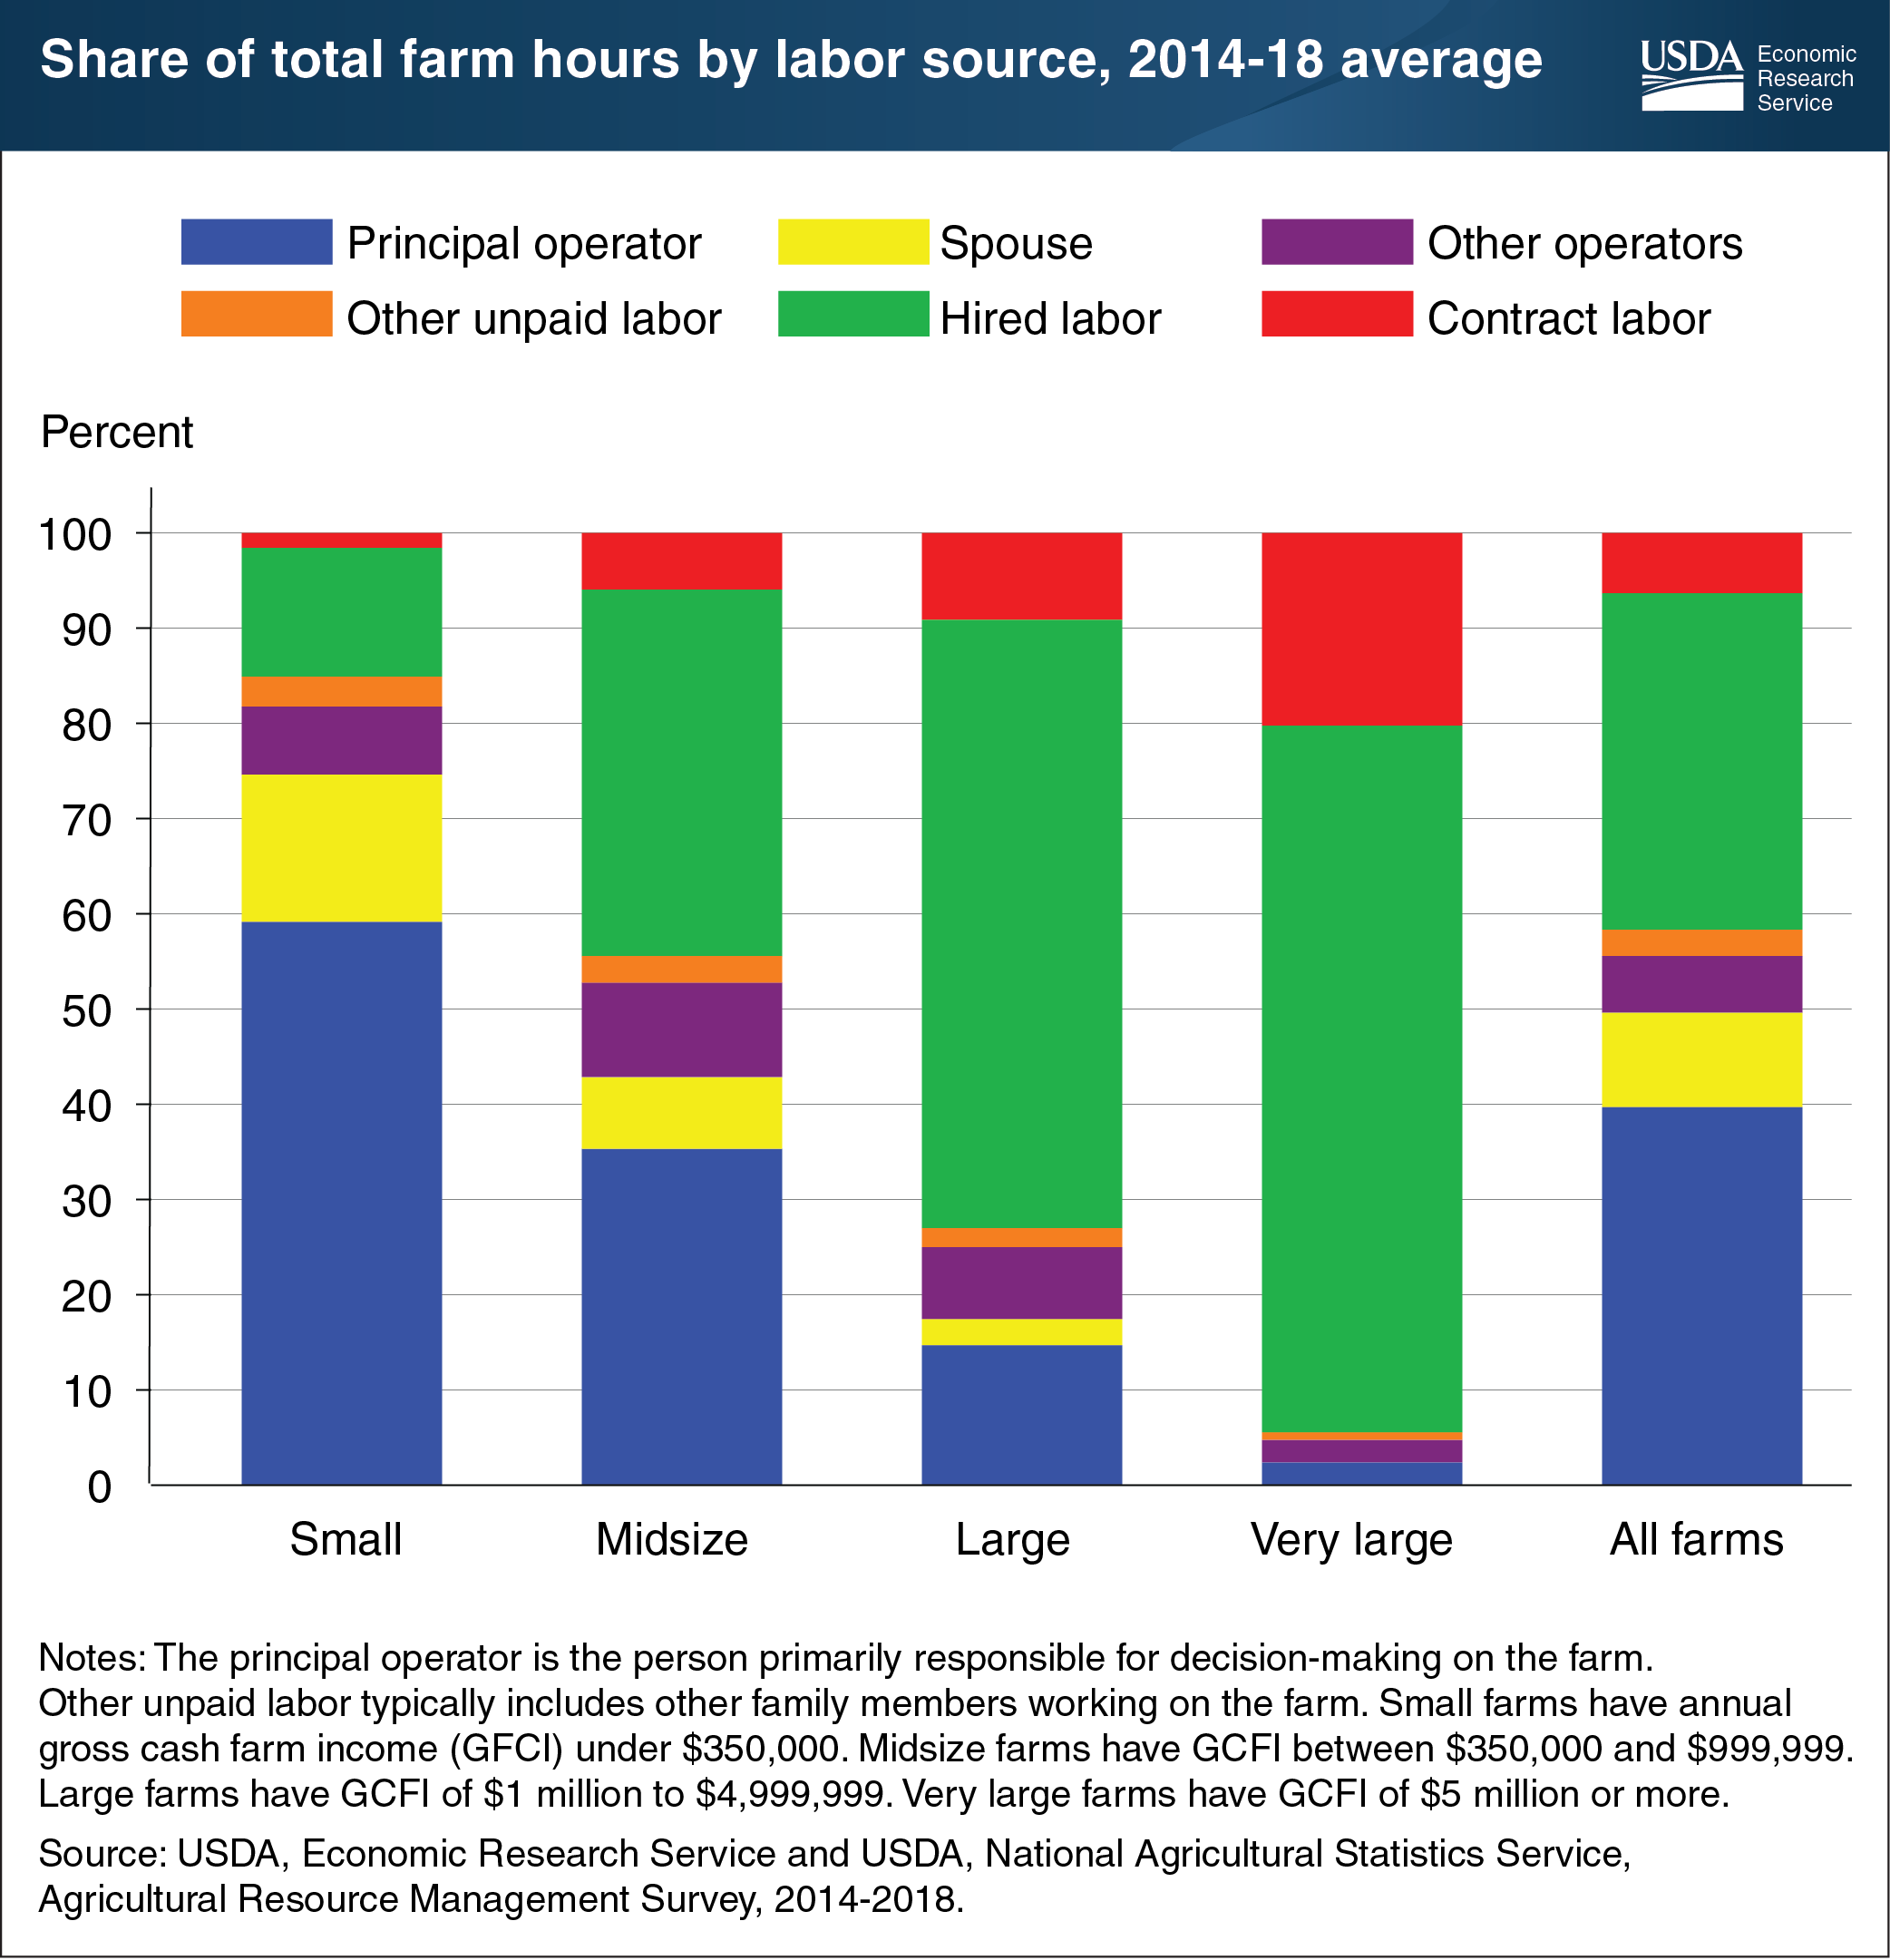
The U.S. agricultural workforce consists of a mixture of two groups of workers: (1) self-employed farm operators and their family members, referred to as “unpaid labor” because their remuneration comes out of farm profits rather than a wage; and (2) paid labor such as hired and contract workers that receive wages. Overall, between 2014 and 2018, U.S. farms used about 59 percent operator, spouse, and family labor, compared to 41 percent paid labor. However, farms of different sizes relied on different mixes of labor. Principal operators and their spouses provided most of the labor hours (76 percent) used on small farms, those with annual gross cash farm income (GCFI) under $350,000. That share fell to 43 percent on midsize farms (GCFI between $350,000 and $999,999), 17 percent on large farms (GCFI between $1 million and $4,999,999), and 2 percent on very large farms (GCFI of $5 million or more). Large and very large farms relied most on hired labor, which provided 64 and 74 percent of the labor hours on those farms, respectively. By comparison, hired labor provided about 12 percent of labor hours on small farms and 39 percent on midsize farms. Contract laborers were important on very large farms (particularly in fruit and vegetable operations), contributing 20 percent of labor hours. This chart updates data found in the March 2018 ERS report, Three Decades of Consolidation in U.S. Agriculture.