
Productivity growth helped accelerate growth in world agricultural output through 2016
- by Keith Fuglie
- 4/3/2020
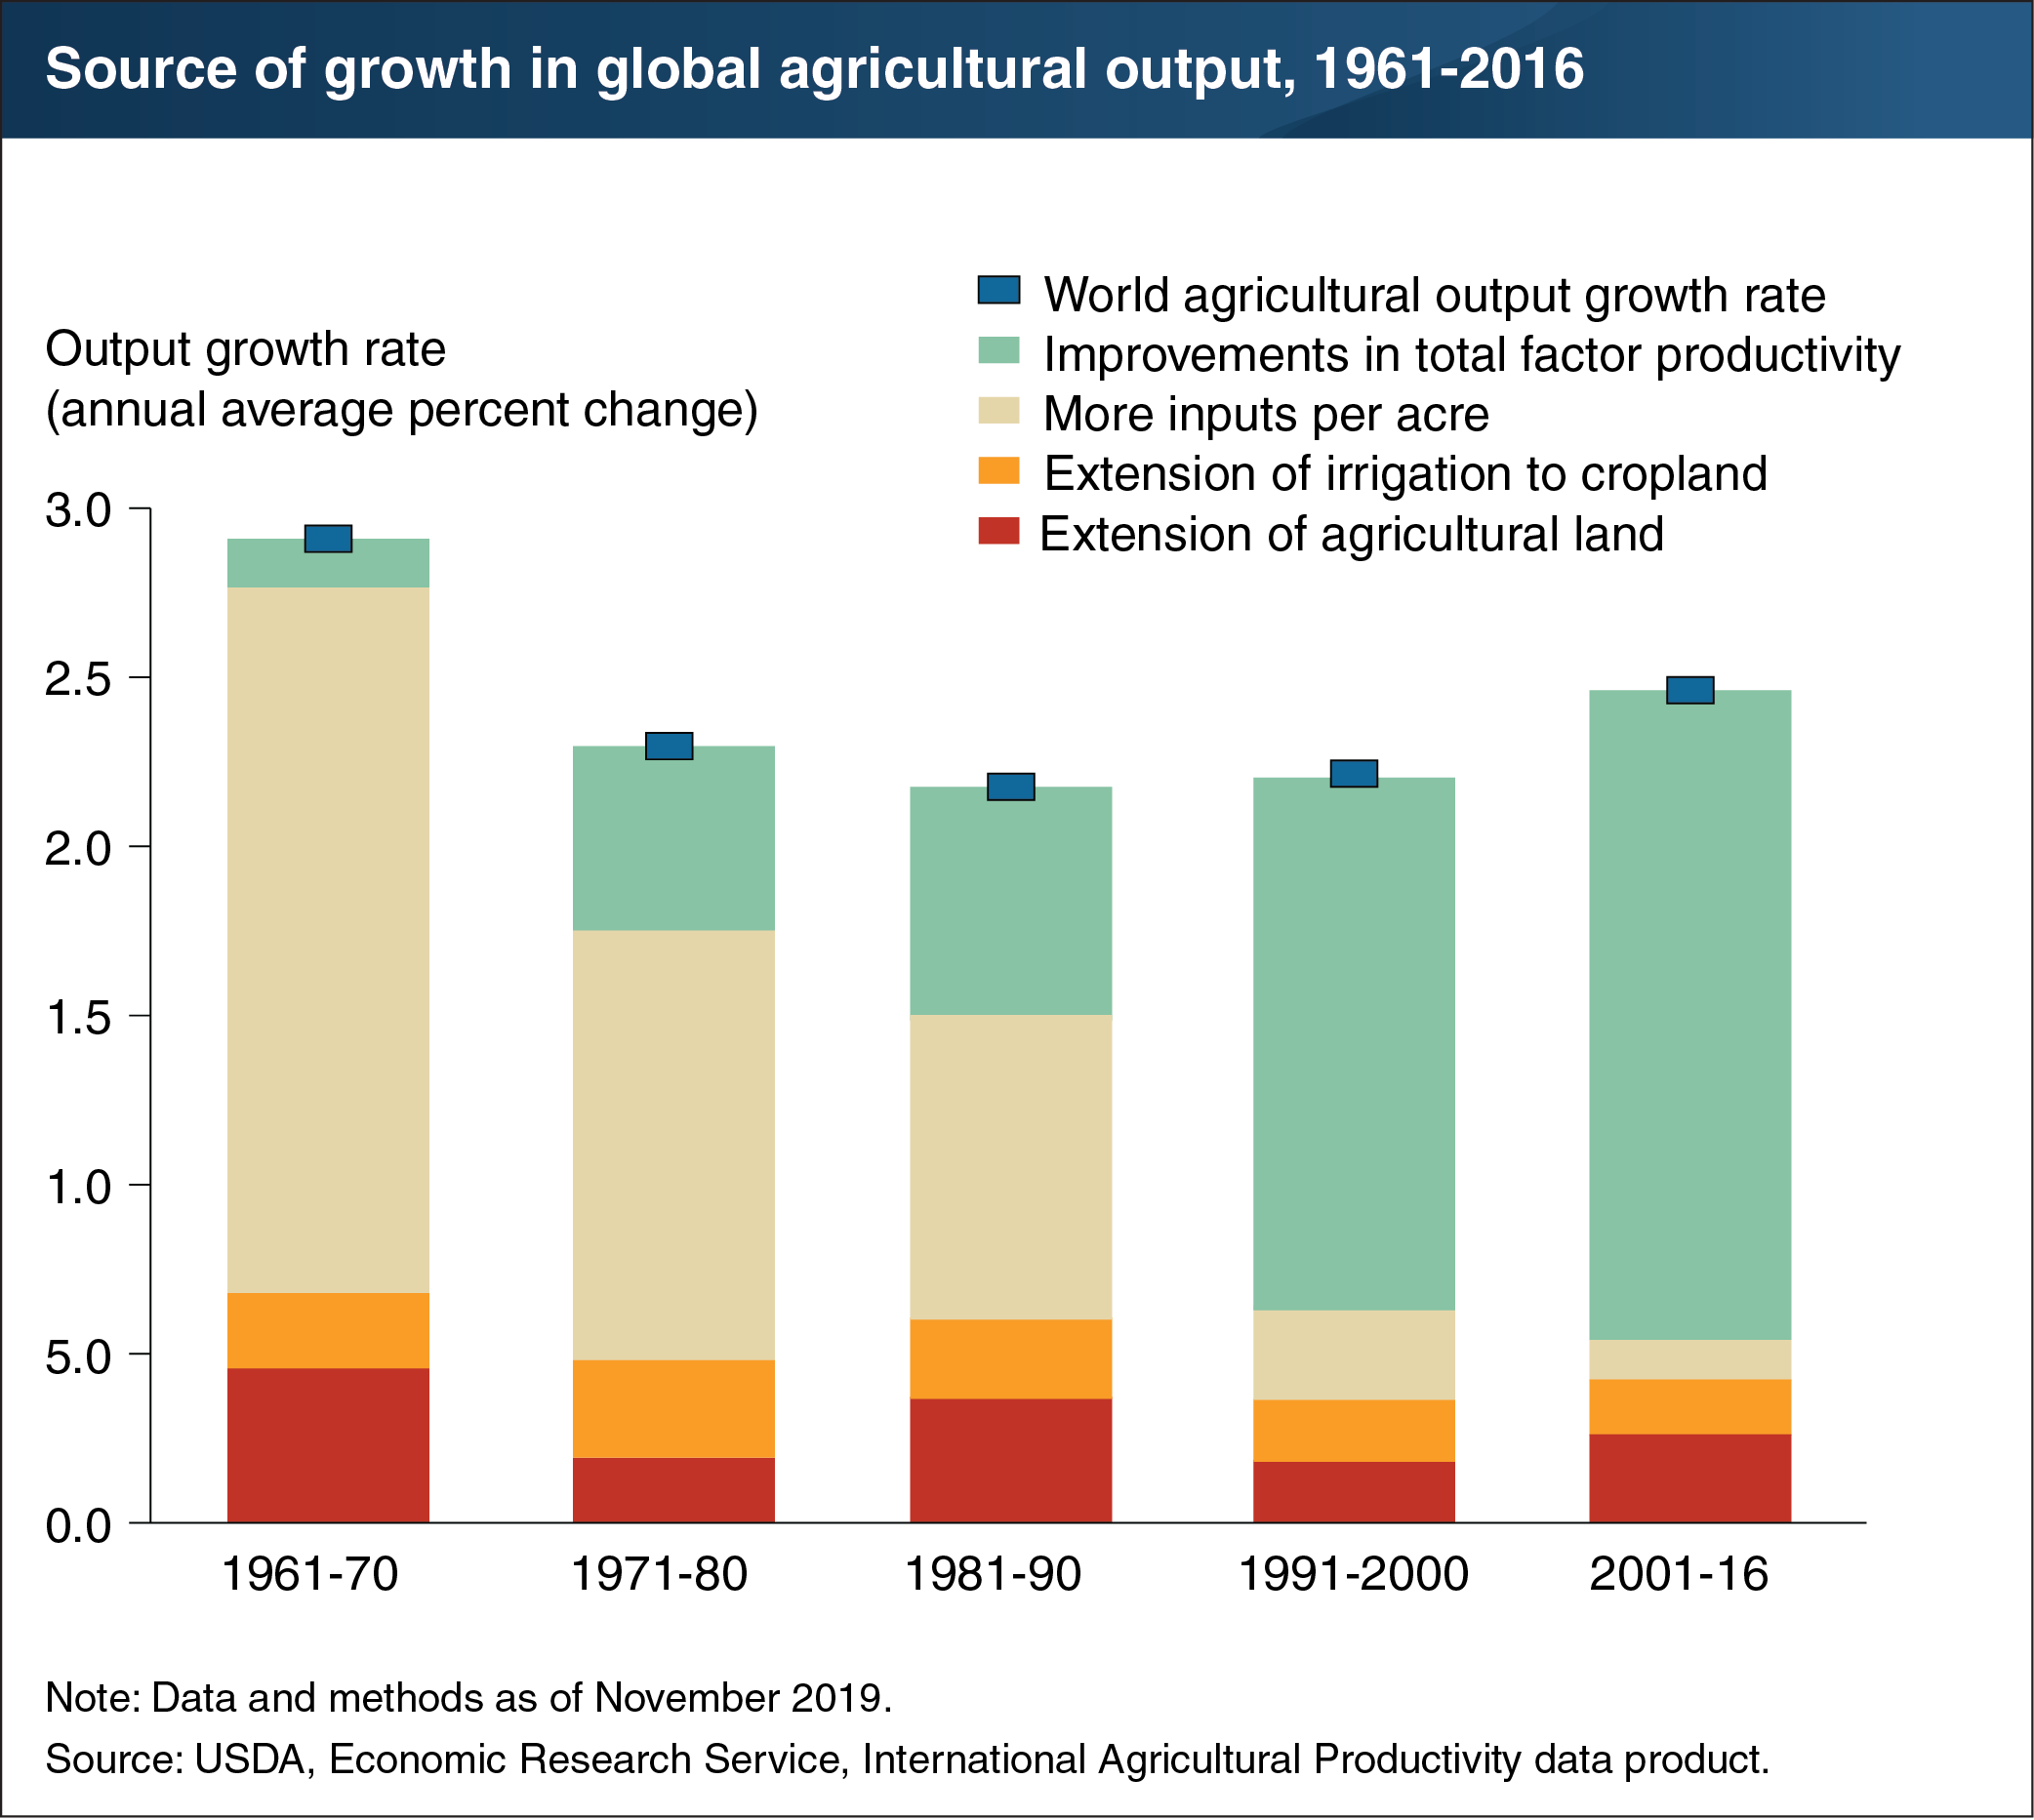
The growth rate of the world’s agricultural output has varied over the decades. Output growth slowed in the 1970s and 1980s, but then accelerated in the 1990s and 2000s. In the latest period for which estimates are available (2001-16), global output of total crop and livestock commodities grew by an average rate of 2.45 percent per year. The different bar colors in the chart show the sources of this output growth. In the decades prior to 1990, most output growth came about from intensification of input use (more labor, capital, and material inputs per acre). Bringing new land into agriculture production and extending irrigation to existing agricultural land were also important sources of growth. During the periods of 1991-2000 and 2001-16, however, the rate of growth in input use significantly slowed. Instead, improvements in agricultural productivity—getting more output from existing resources—drove global output growth. Total factor productivity (TFP) grew from the adoption of new technologies, management practices, and other efficiency improvements in farming around the world. Between 2001 and 2016, TFP accounted for 77 percent of the total growth in agricultural output worldwide. This chart appears in the Economic Research Service topic page for International Agricultural Productivity Summary Findings, updated November 2019.