
U.S. per capita consumption of total meat was up in 2017
- by Andrzej Blazejczyk
- 2/12/2020
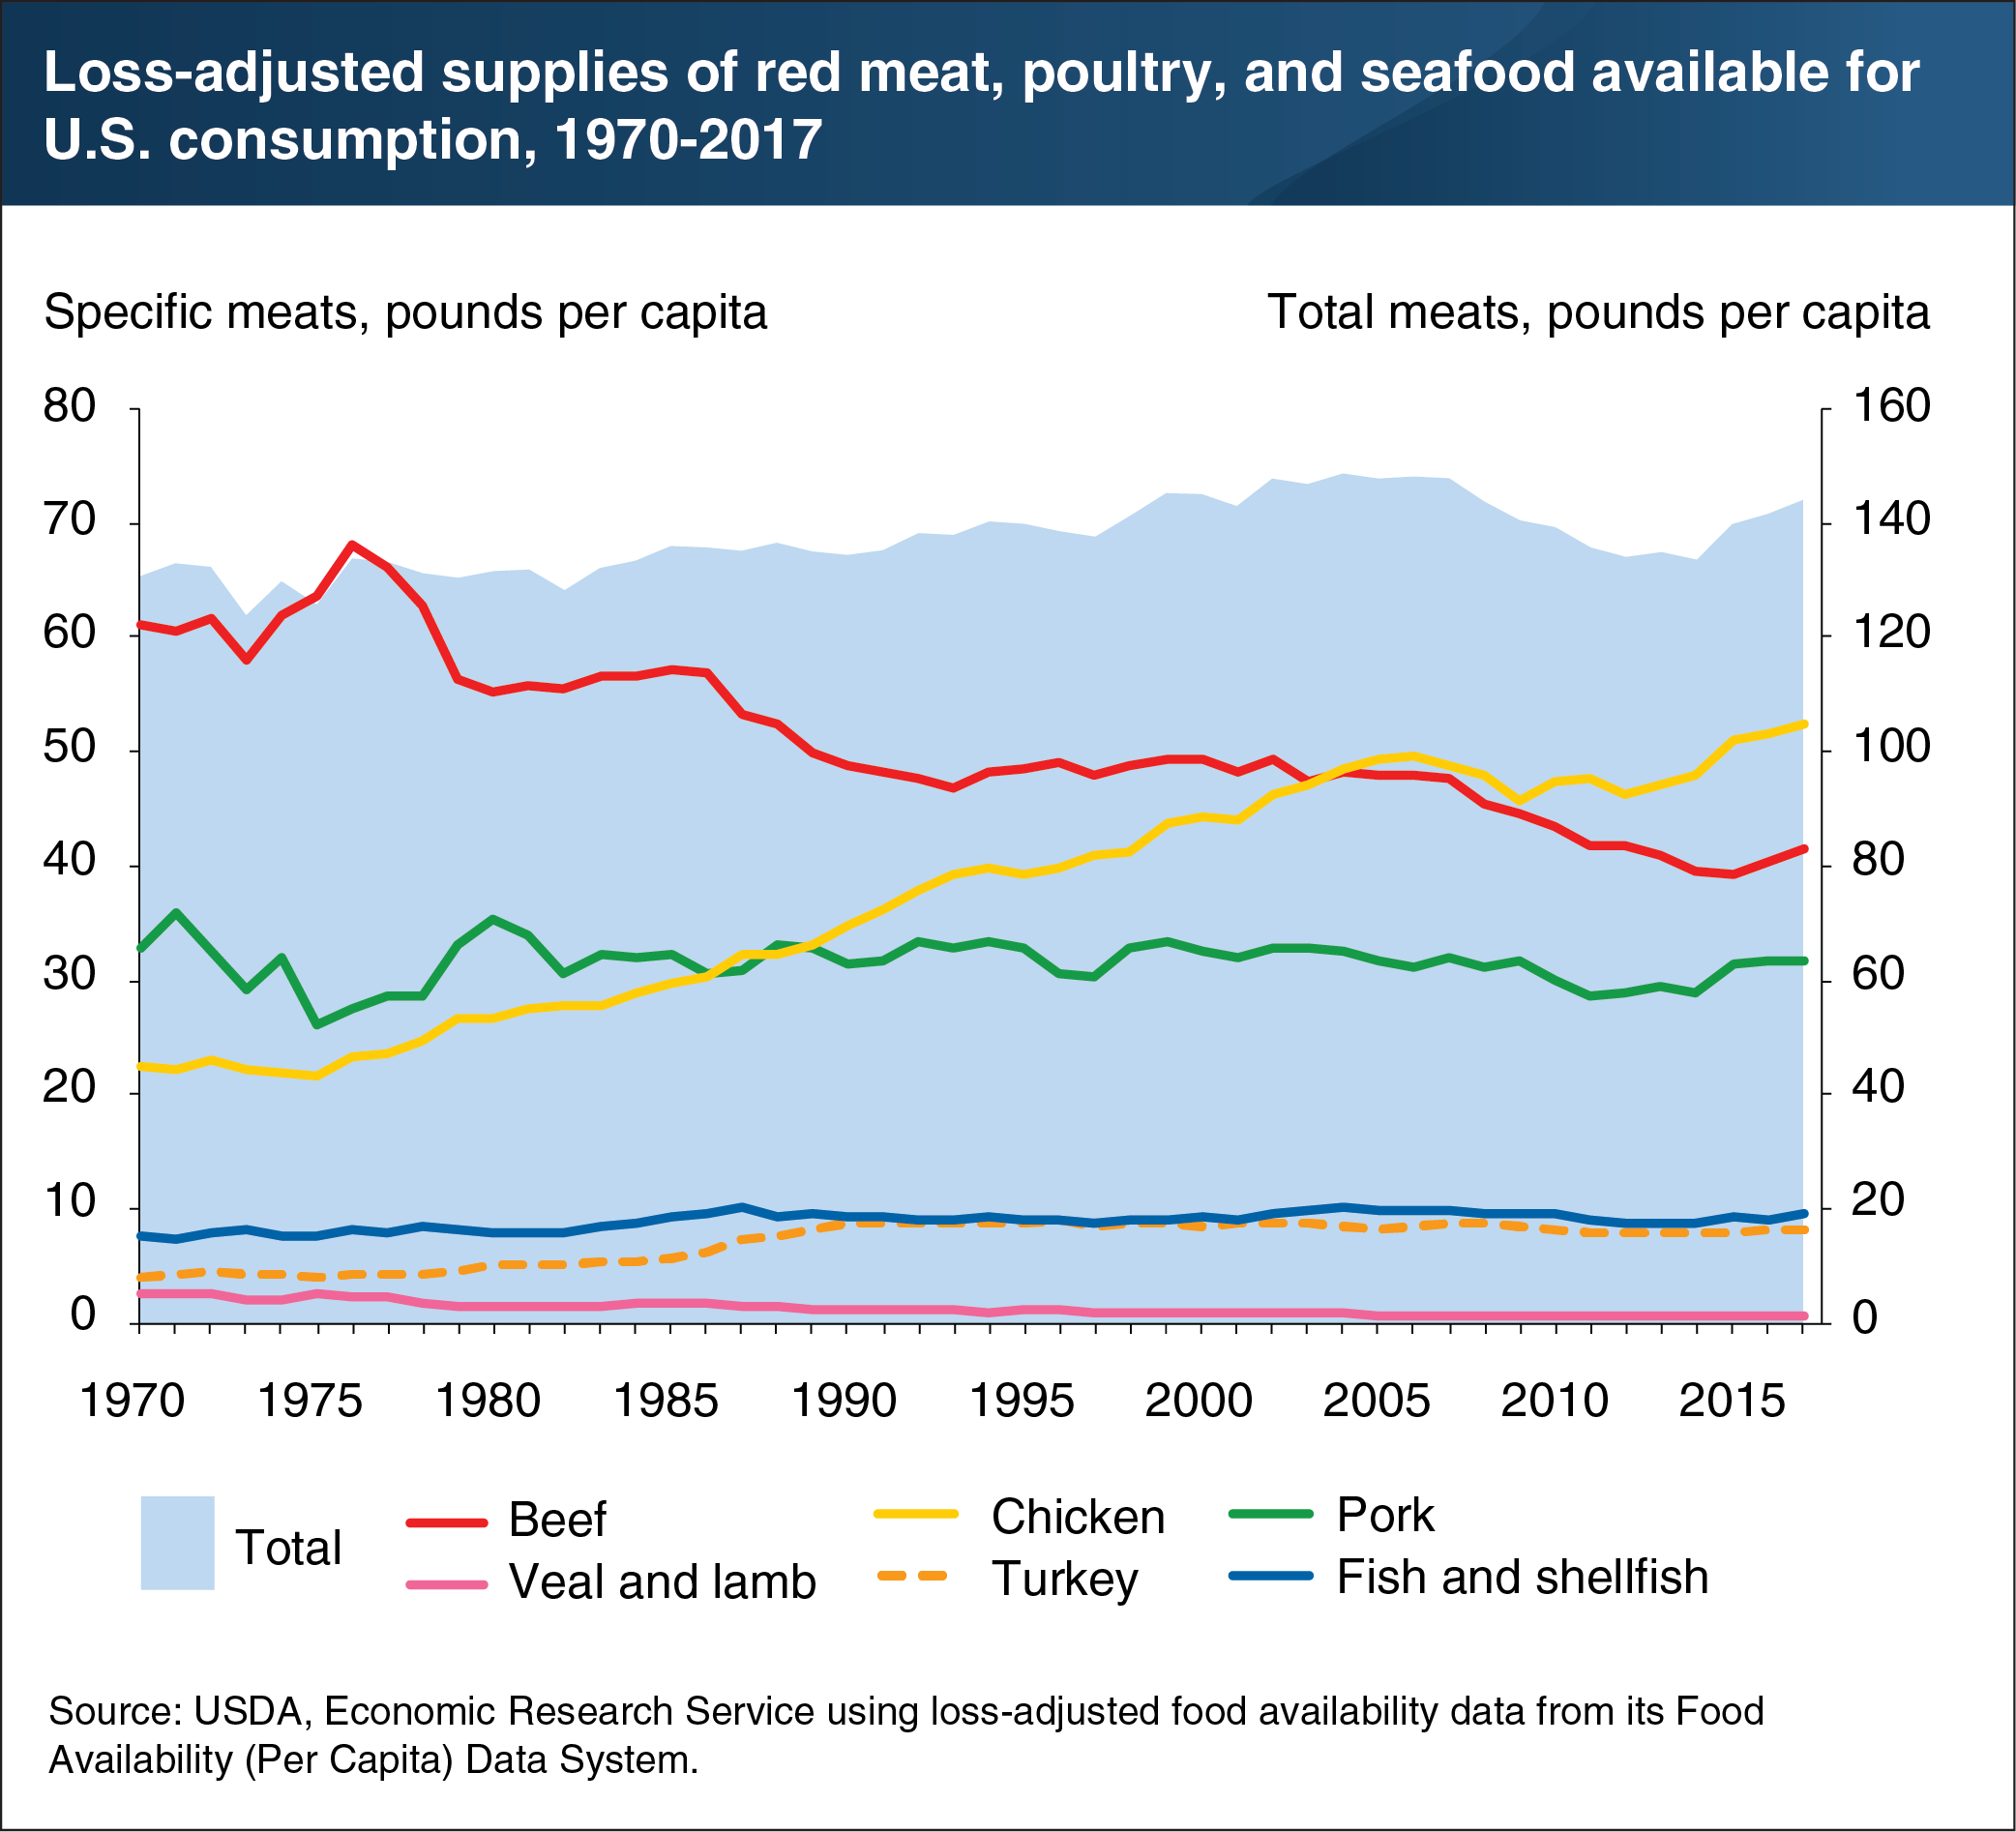
In 2017, the per capita supply of red meat, poultry, and fish and shellfish available for Americans to eat, after adjusting for some of the spoilage, plate waste, and other losses in grocery stores, restaurants, and homes, rose to 143.9 pounds, continuing an upward trend that began in 2014 after an earlier decline. The 7.8-percent rise from 2014’s total was largely driven by increases in loss-adjusted availability of beef and chicken. Over 2015-17, beef had the largest percentage increase in per capita loss-adjusted availability—growing by 6 percent. Recovering consumer incomes after the 2007-09 recession and stable or declining retail prices have increased U.S. consumers’ demand for red meat in recent years. For chicken, the recent increase continues an upward trend that saw loss-adjusted availability of chicken more than doubling from 22.4 pounds per capita in 1970 to 52.3 pounds per capita in 2017. Efficiencies in chicken production have expanded supplies and kept prices in check. This chart appears in “U.S. Per Capita Availability of Red Meat, Poultry, and Seafood on the Rise” in ERS’s December 2019 Amber Waves.