
Potential effects of climate change on agricultural productivity likely to vary by region
- by Sun Ling Wang and Elizabeth Marshall
- 9/9/2019
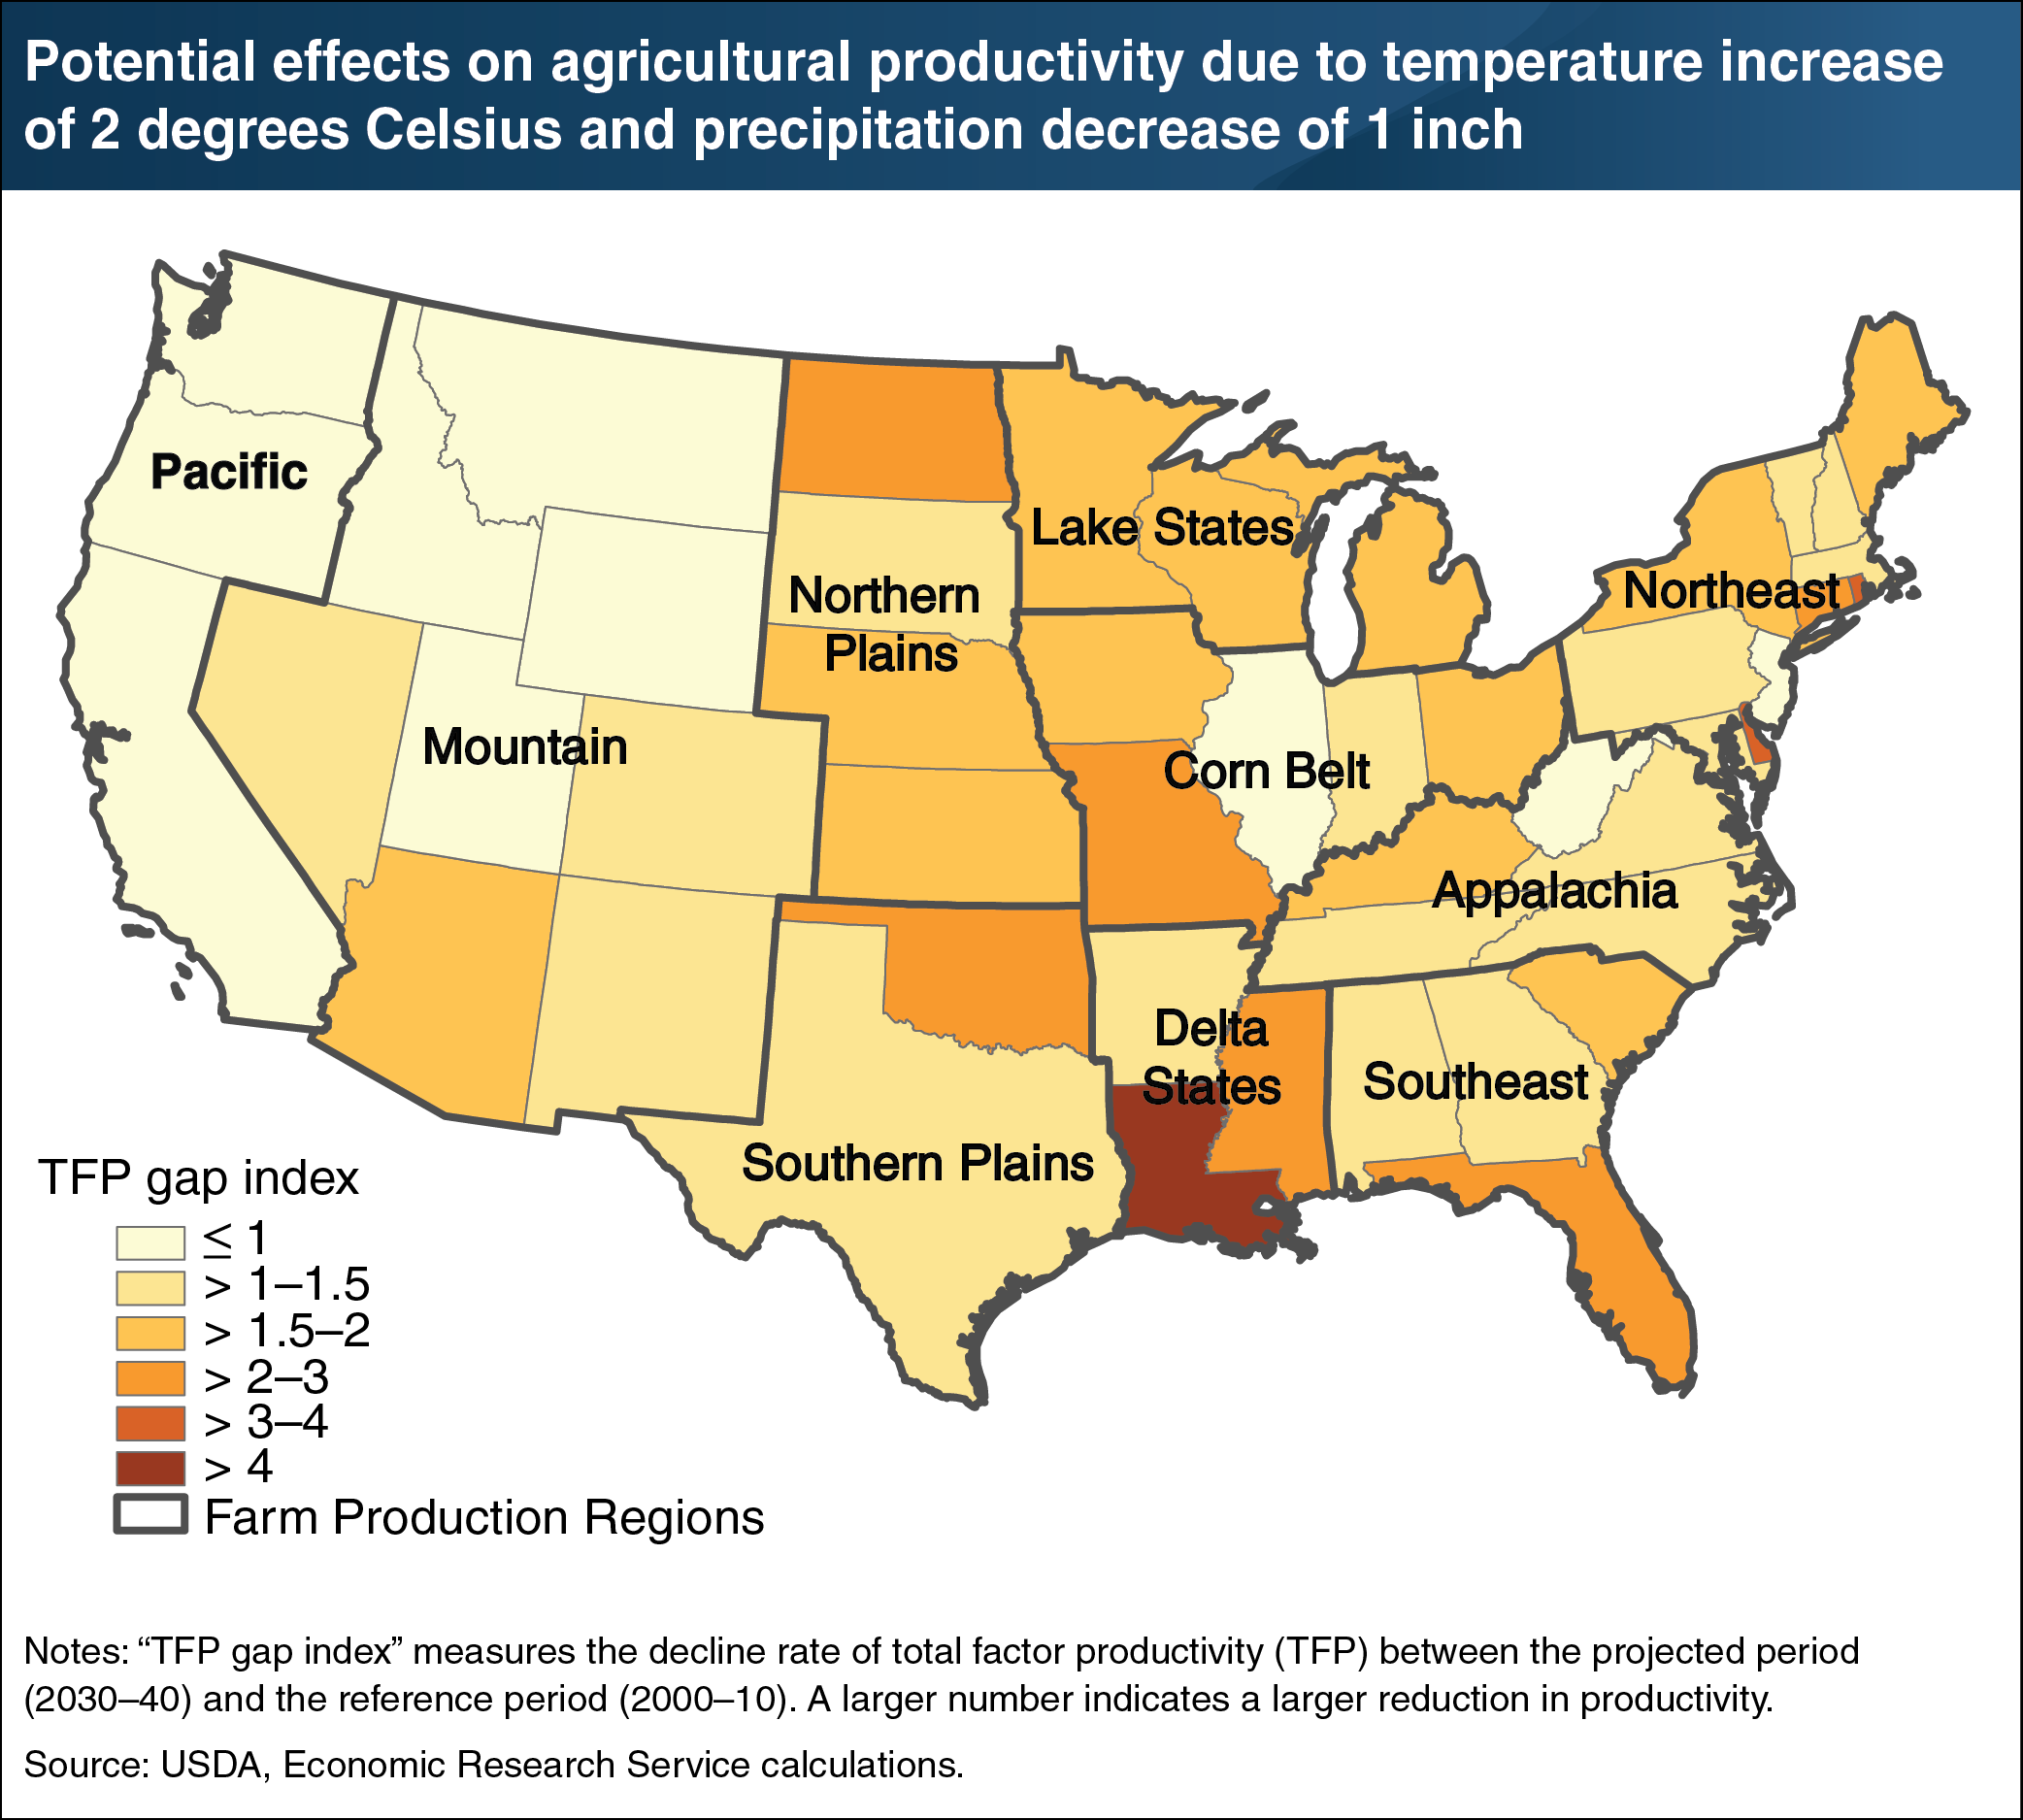
U.S. farm output since 1948 has grown by 170 percent. Increases in total factor productivity (TFP), measured as total output per unit of total input, accounted for more than 90 percent of that output growth. However, TFP growth rates fluctuate considerably year-to-year, mostly in response to adverse weather, which can lower productivity estimates. Recent ERS research modeled a future climate-change scenario with an average temperature increase of 2 degrees Celsius (3.6 degrees Fahrenheit) and a 1-inch decrease in average annual precipitation. Results showed that the “TFP gap index”—the difference in total-factor productivity levels between the projected period (2030–40) and the reference period (2000–10)—varies by State. For some States, those climate changes fall within the range of what is historically observed, while for other States they do not, which accounts for regional variation. States in the latter category are projected to experience larger effects. The States experiencing the greatest impacts would include Louisiana and Mississippi in the Delta region; Rhode Island, Delaware, and Connecticut in the Northeast region; Missouri in the Corn Belt region; Florida in the Southeast region; North Dakota in the Northern Plains region; and Oklahoma in the Southern Plains region. This chart appears in the Amber Waves article, “Climate Change Likely to Have Uneven Impacts on Agricultural Productivity,” released August 2019.