
High rates of disability among farmers are concentrated in the South
- by Cristina Miller
- 6/27/2019
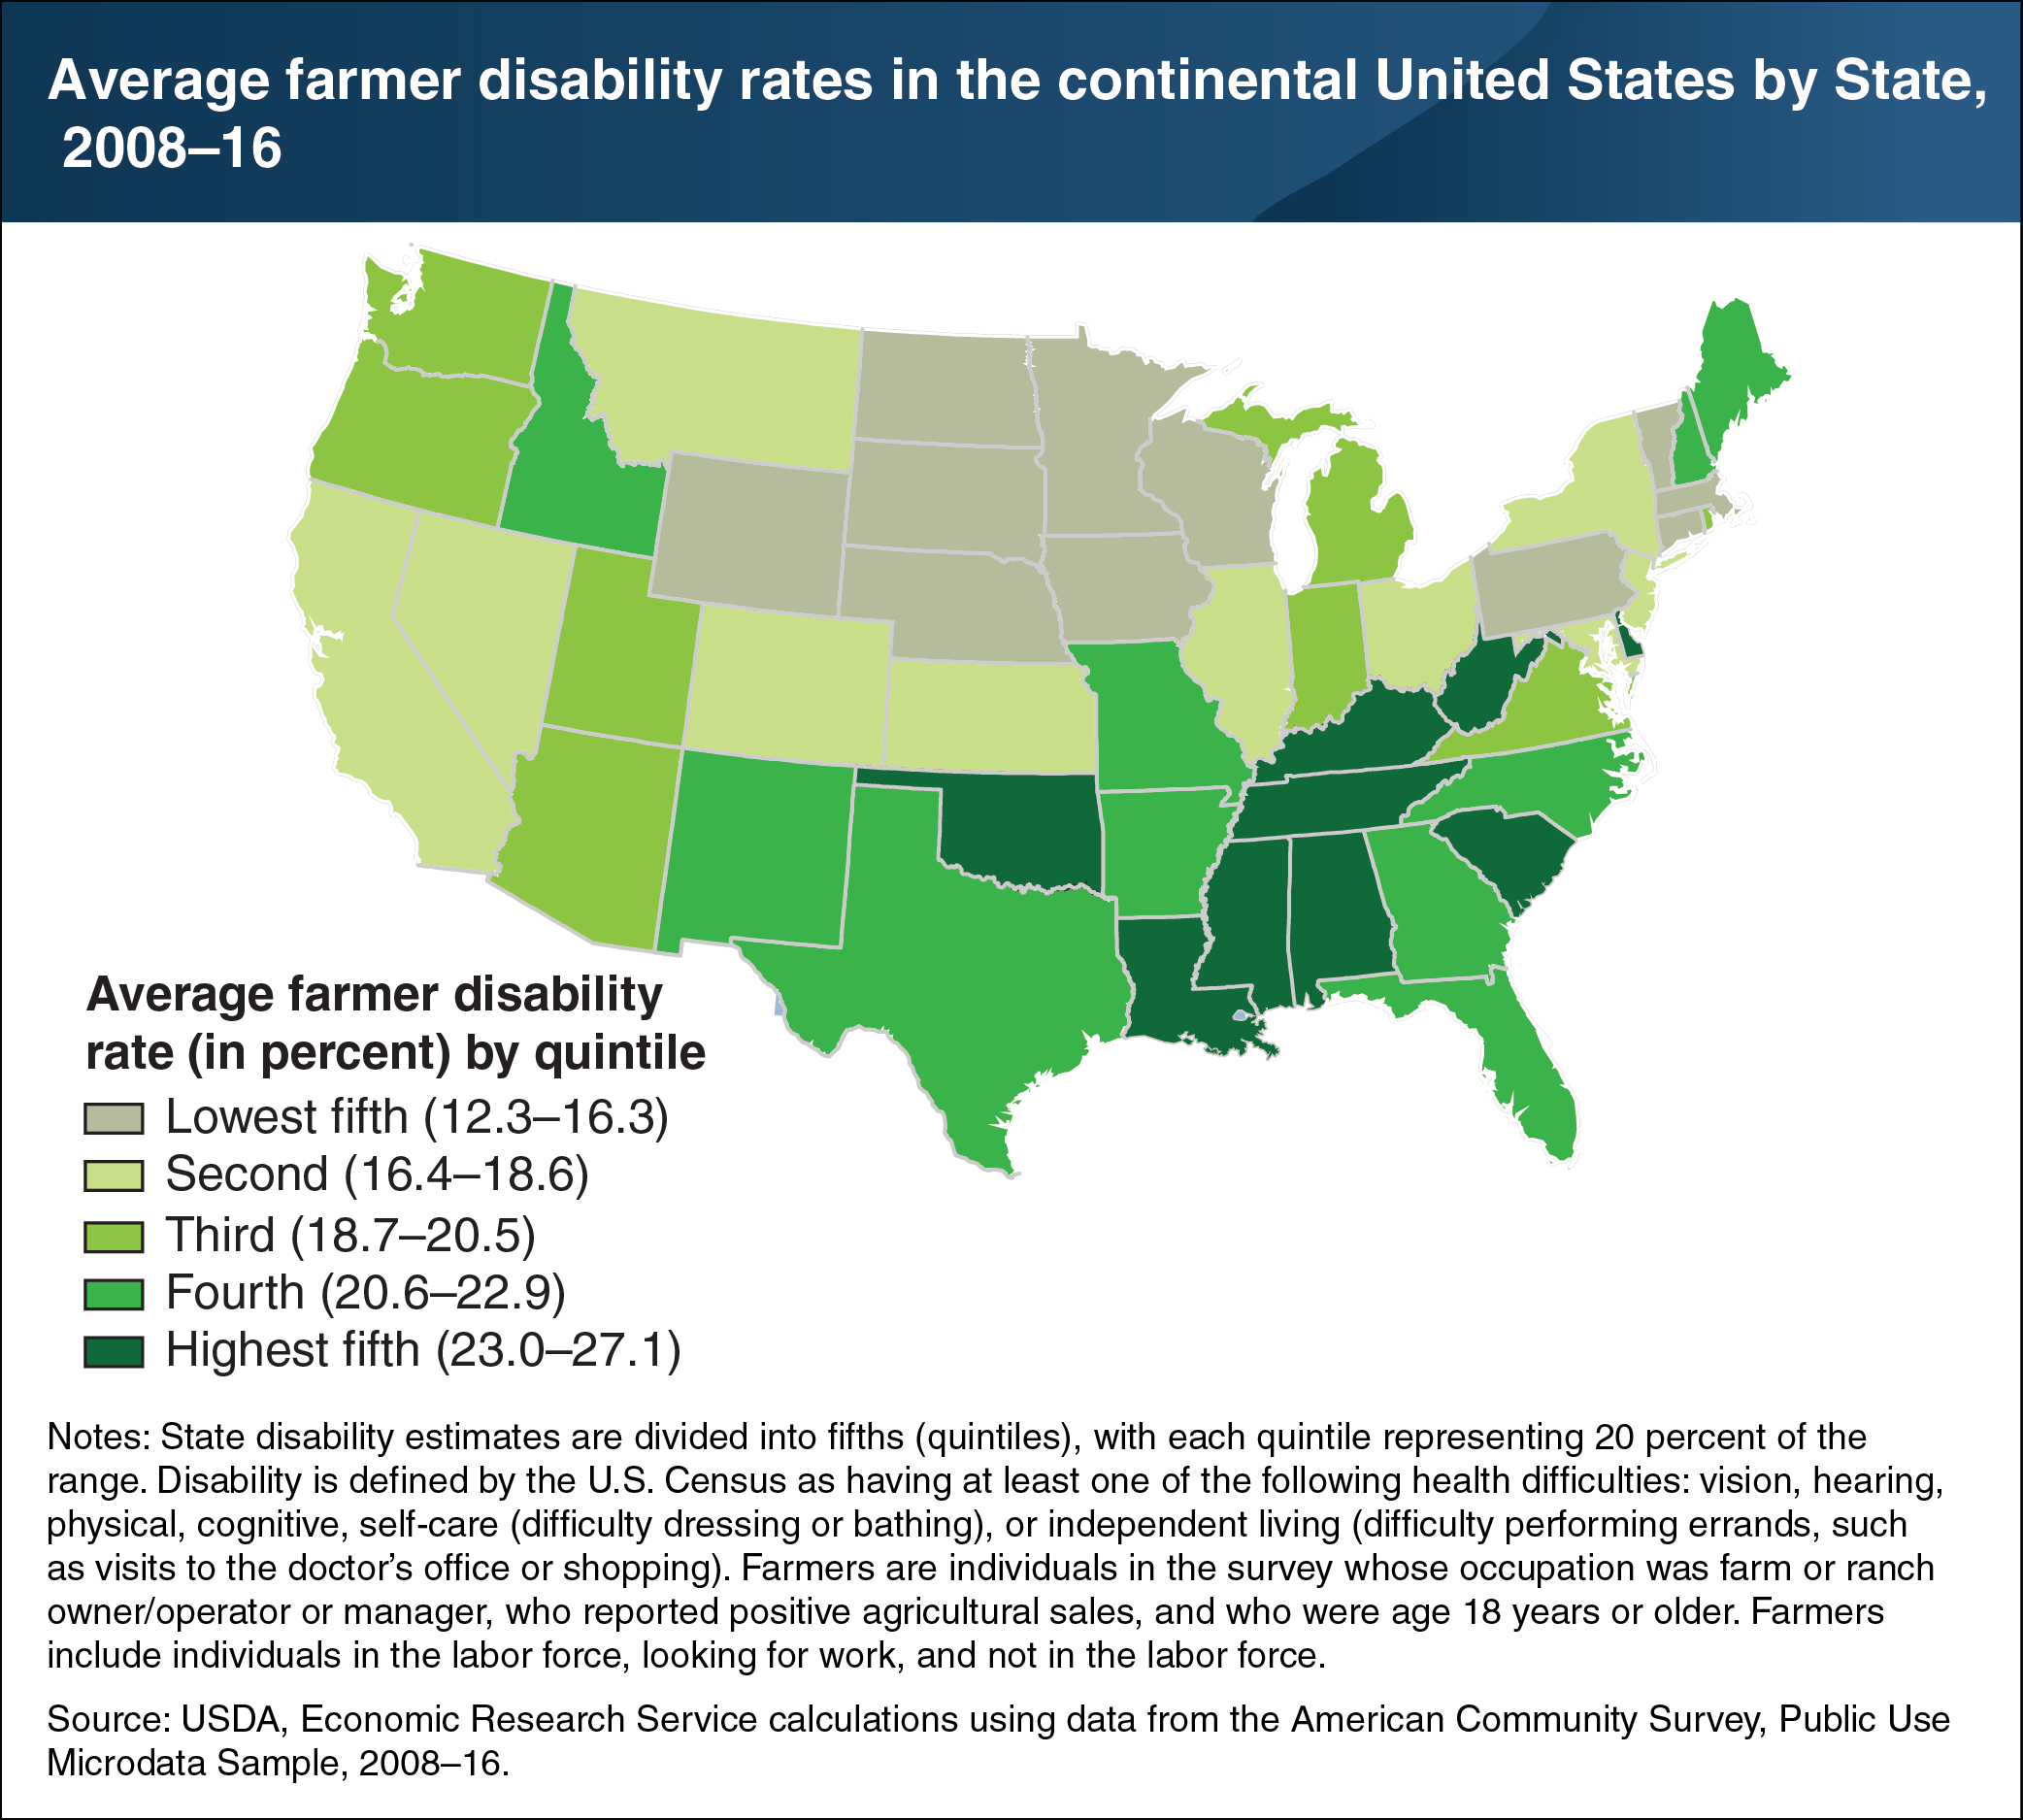
Farmers face various occupational hazards (such as machinery, livestock, and chemicals) that can lead to temporary or permanent disabilities. The U.S. Census Bureau defines disabilities as having at least one of the following health difficulties: vision, hearing, physical, cognitive, self-care (difficulty dressing or bathing), or independent living (difficulty performing errands, such as visits to the doctor’s office or shopping). Recent ERS research estimated that an average of about 20 percent of U.S. farmers (395,000 people) had a disability at some point between 2008 and 2016. The probability of disability among farmers increased with age but was lower for farmers who had higher education levels, were female (compared to male), or were married (compared to unmarried). The most common disabilities included physical (10 percent of farmers) and hearing (8 percent of farmers). Average disability rates varied by State. For example, Wisconsin, Pennsylvania, and Iowa were in the quintile with the lowest disability rates on average (12.3 percent to 16.3 percent), while Louisiana, Alabama, and Tennessee were in that with the highest farmer disability rates (23.0 percent to 27.1 percent). This chart appears in the April 2019 Amber Waves finding, “Disabilities in the U.S. Farm Population.”