
Southern States had highest shares of low-income and low-food-access census tracts in 2015
- by Alana Rhone
- 6/18/2019
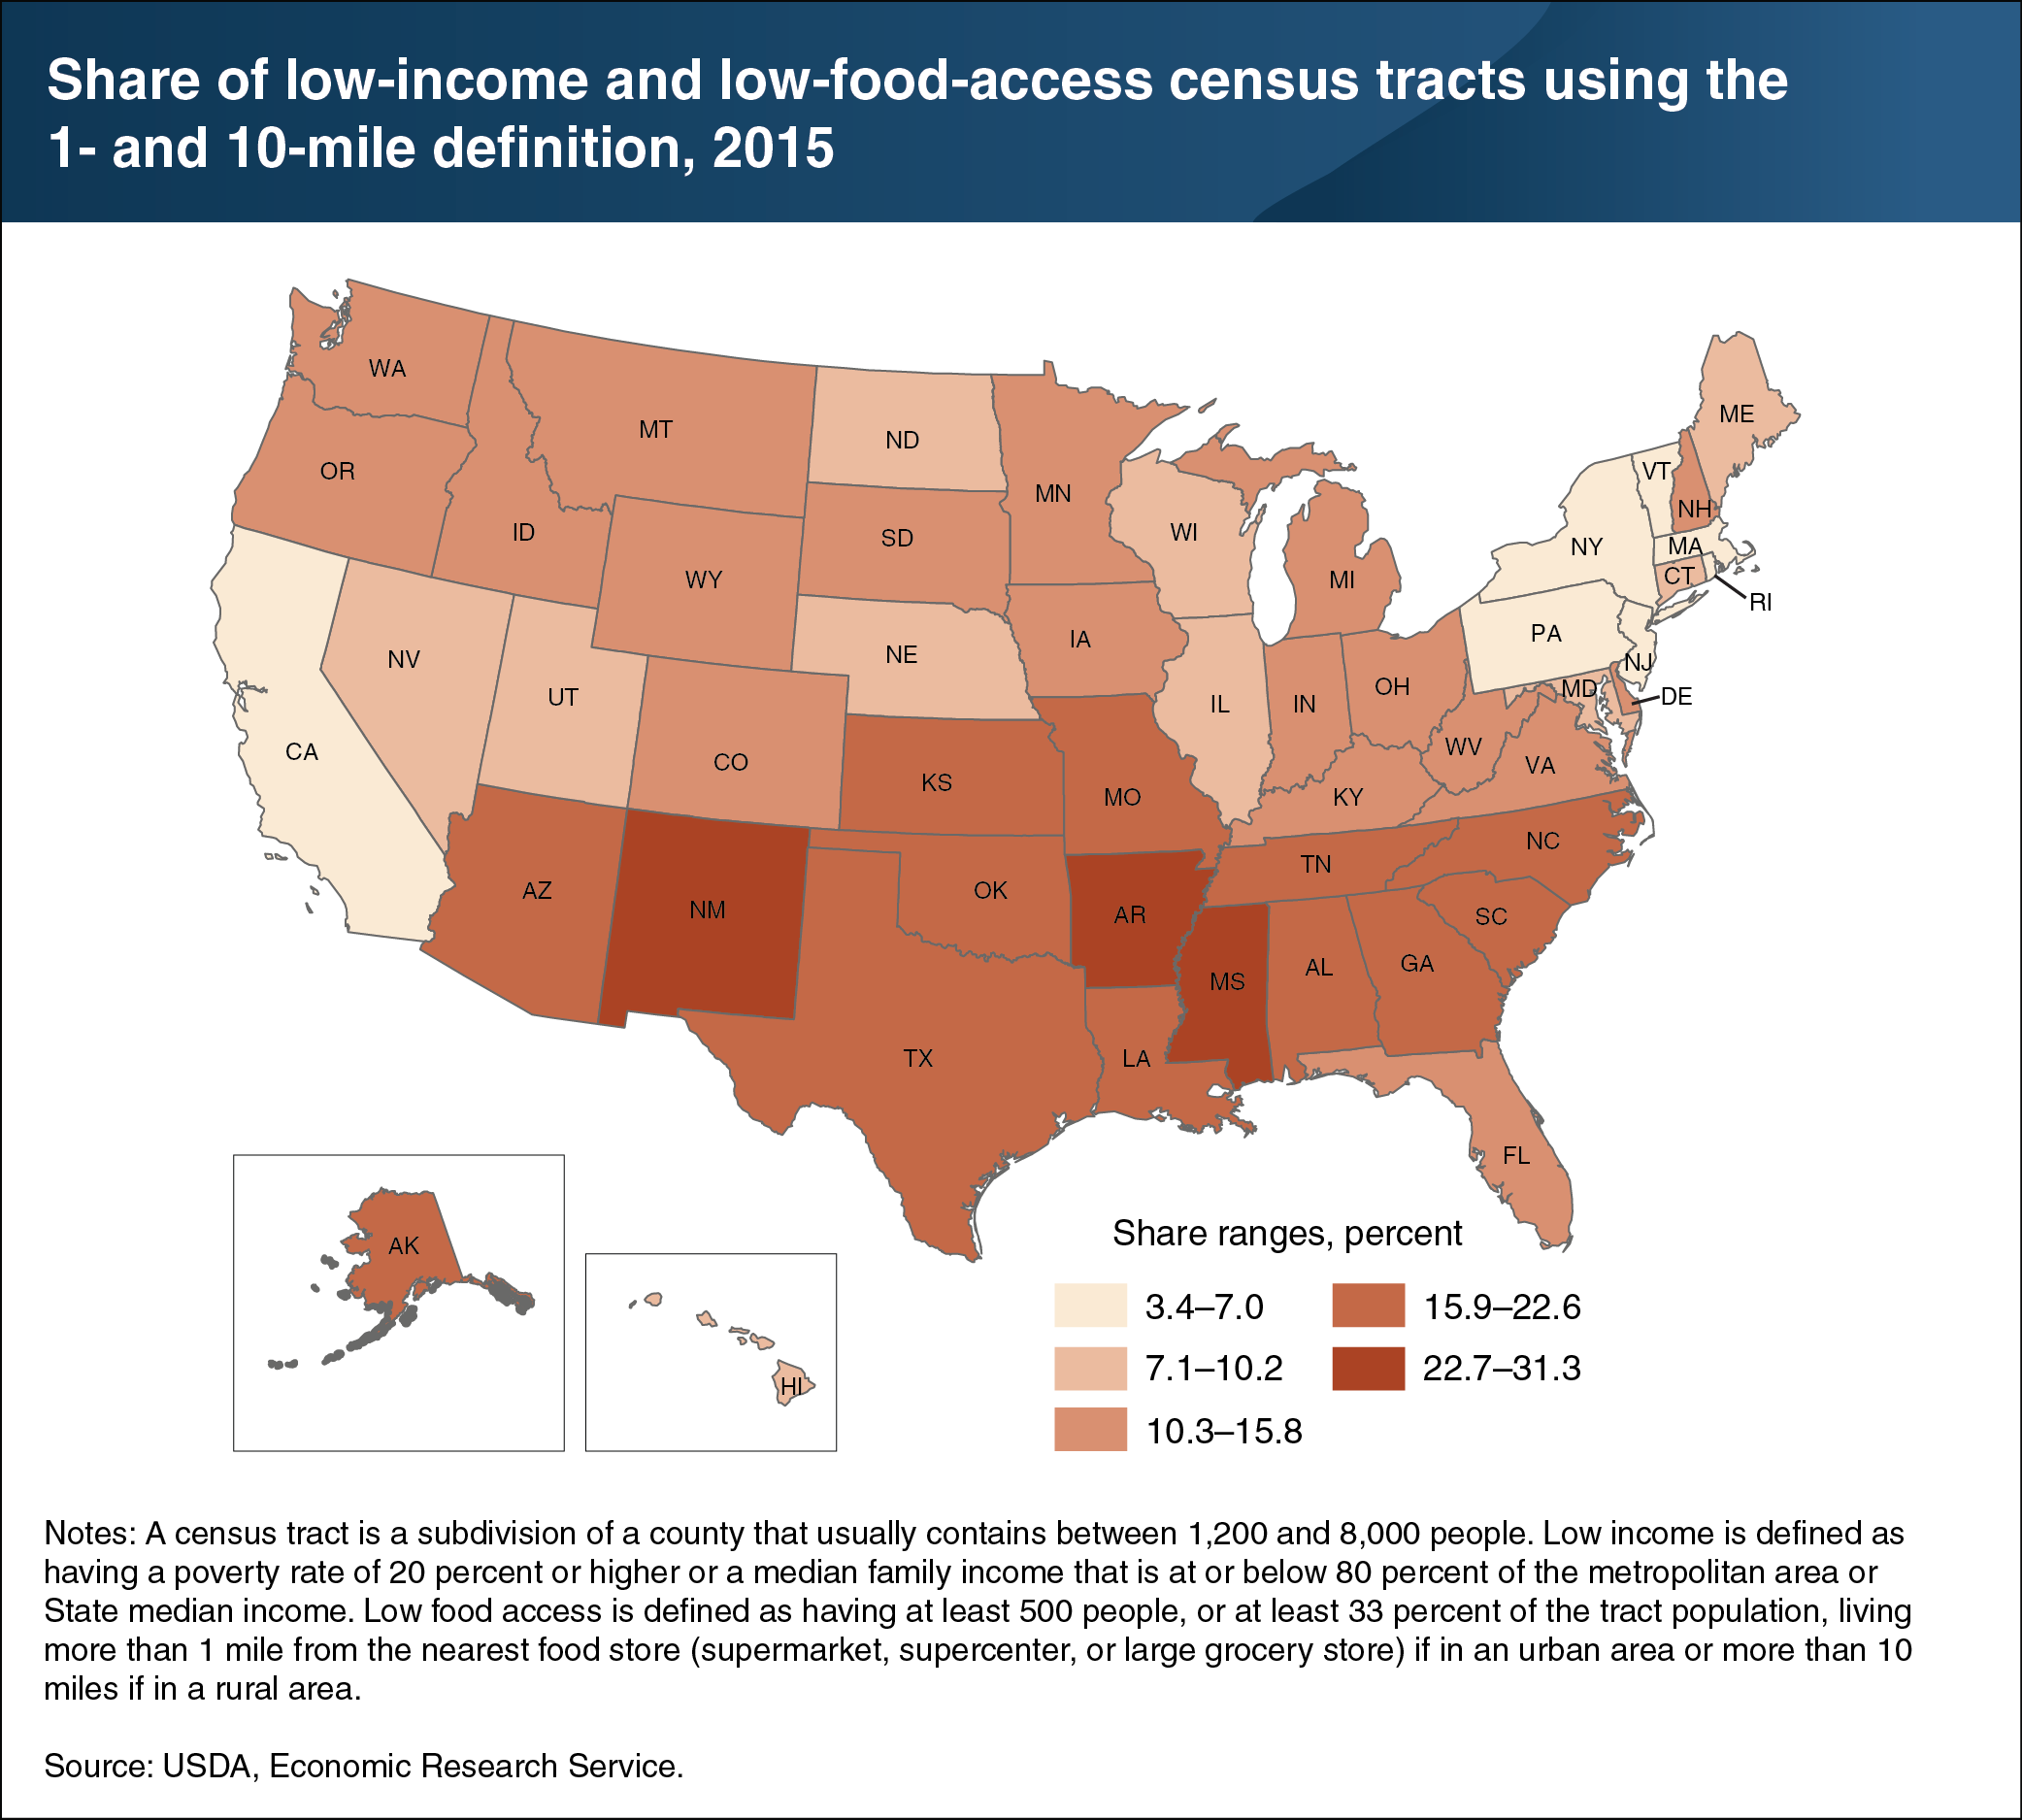
Some Americans and some neighborhoods have limited access to the variety of healthful foods offered by food stores (supermarkets, supercenters, and large grocery stores). A recent ERS study examined food store access by State in terms of what share of the census tracts in each State were both low income and had low access to food stores. (See chart notes for definitions of census tracts, low income, and low food access.) States with the greatest shares of low-income/low-access tracts tended to be in the South, reflecting that region’s higher poverty rates relative to other regions. In three States—Arkansas, Mississippi, and New Mexico—more than 25 percent of tracts were low income and low access in 2015. In that same year, less than 5 percent of the tracts in New York, Rhode Island, Vermont, and the District of Columbia were low income and low access. This chart appears in the ERS report, Understanding Low-Income and Low-Access Census Tracts Across the Nation: Subnational and Subpopulation Estimates to Access to Healthy Food, May 2019.