
Imports from Latin America make up a growing share of U.S. blueberry consumption
- by Agnes Perez
- 6/13/2019
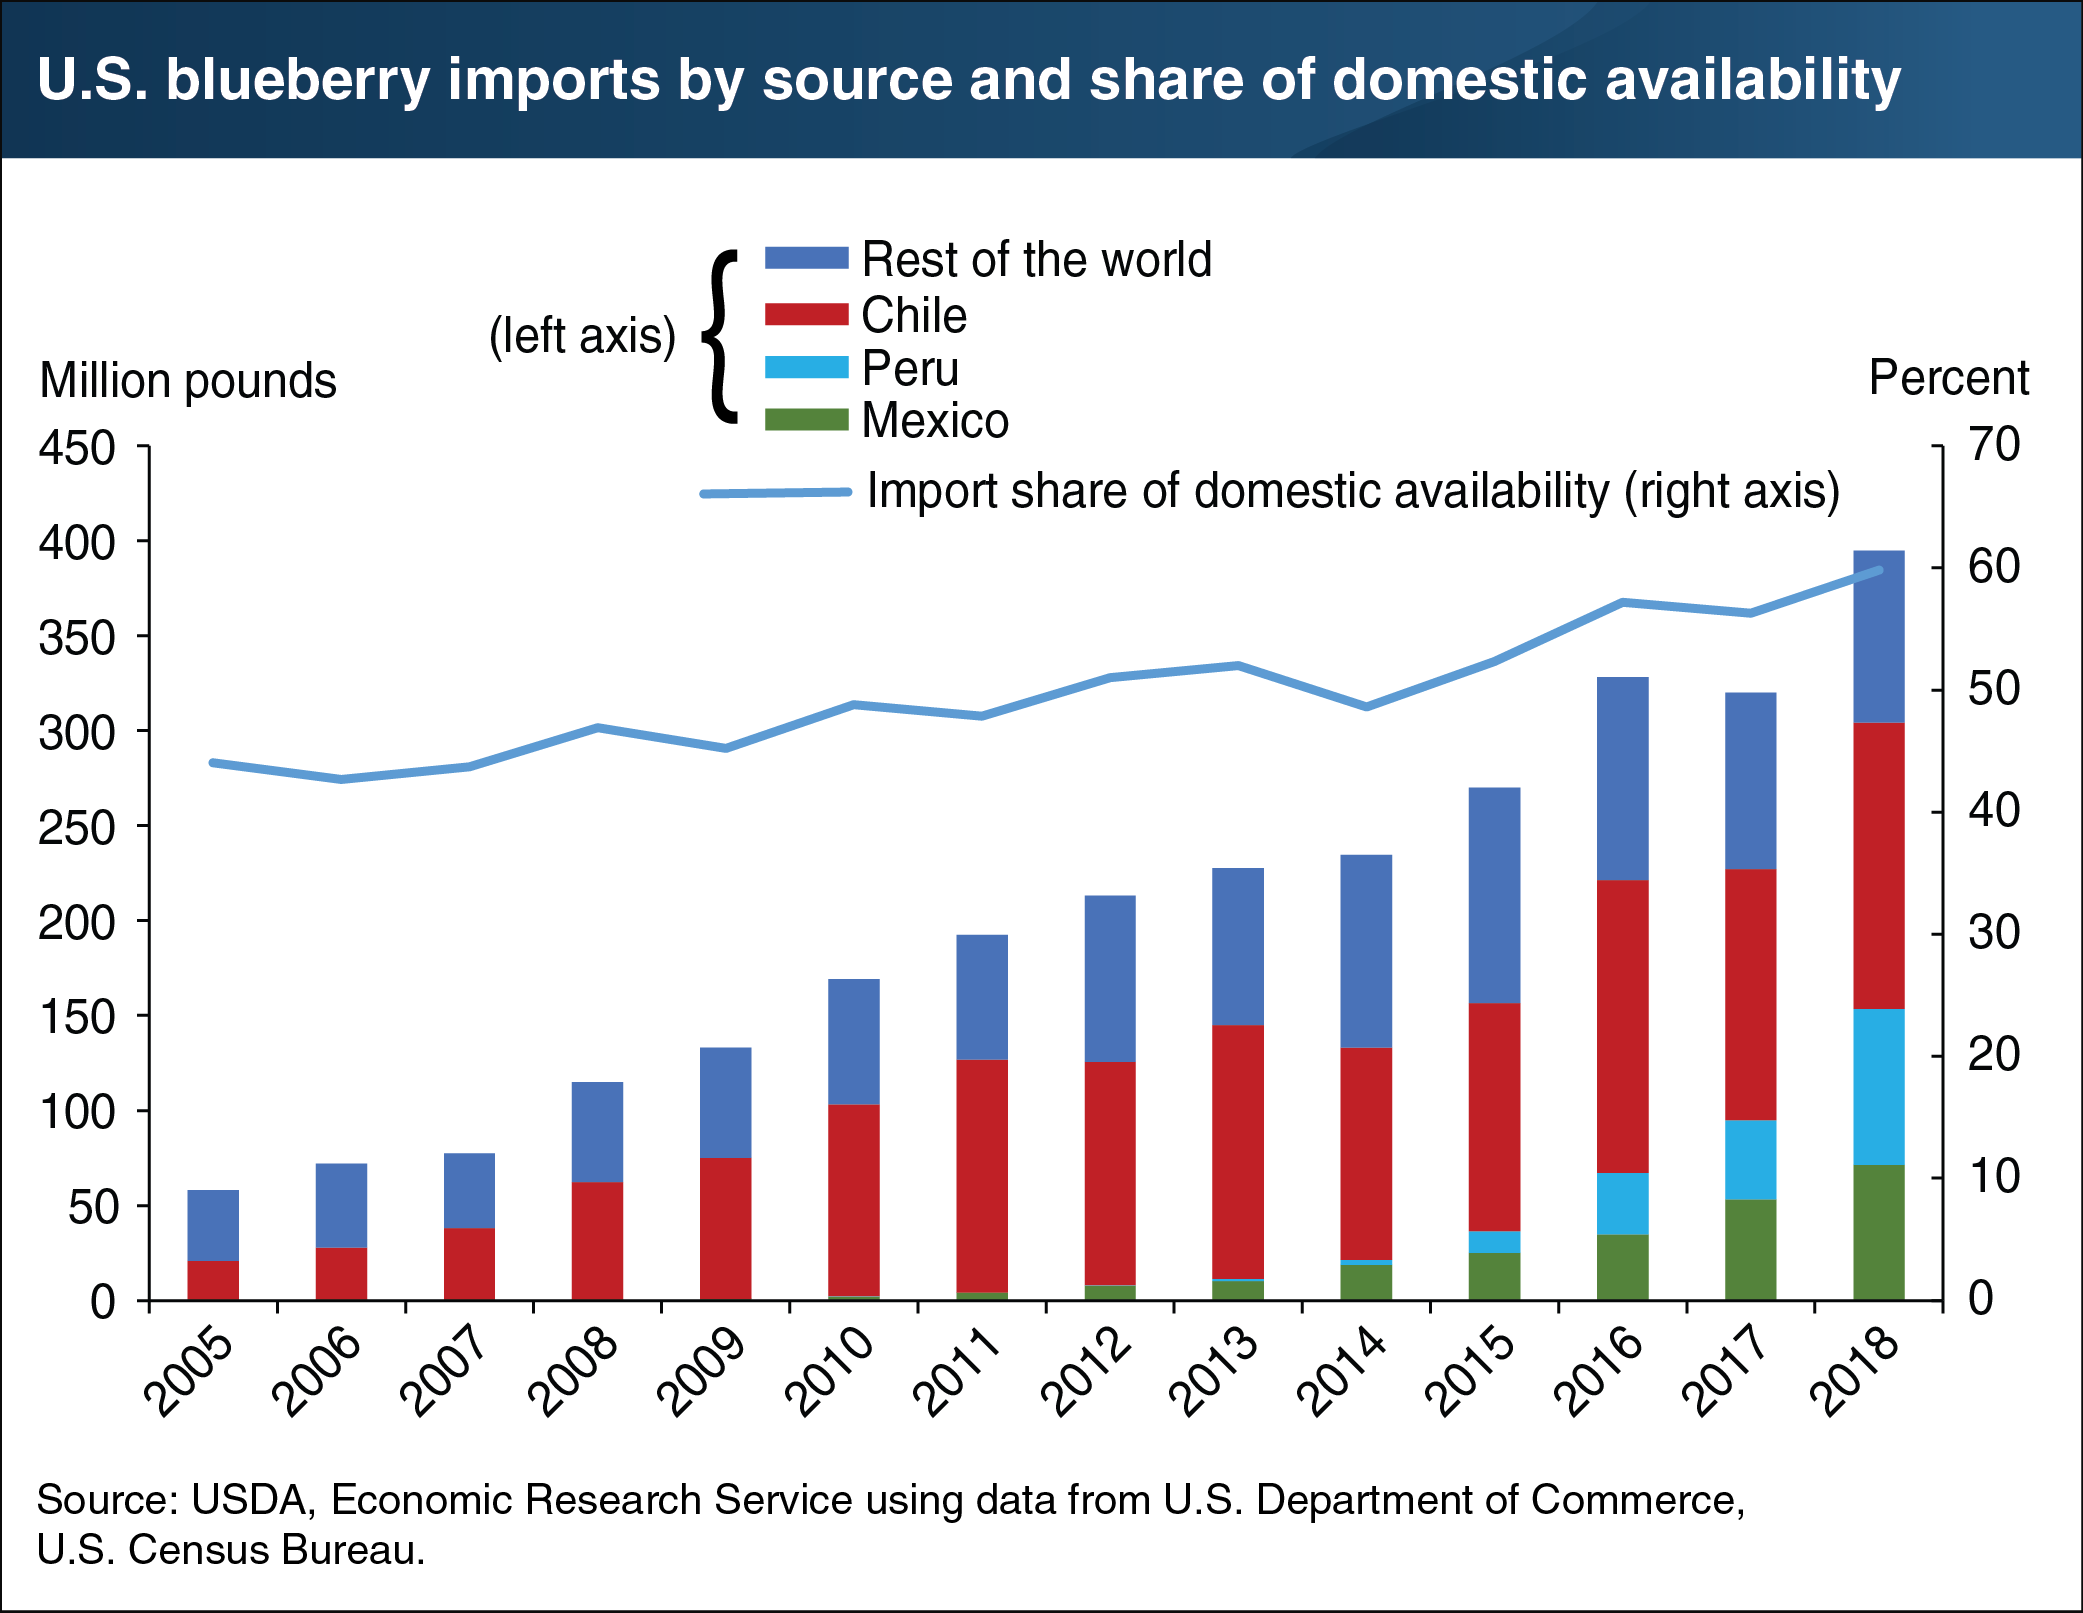
U.S. per capita consumption of blueberries has more than tripled since the mid 2000’s. Availability of blueberries is forecasted to reach record levels in the 2018/19 marketing season, totaling 660 million pounds. Rising U.S. demand over the last two decades has been supported by increased availability from domestic production and imports. Imports, however, have risen more rapidly than domestic production. Imports’ share of the U.S. market rose from 44 percent in 2005 to nearly 60 percent in 2018. Chile has long been the leading source for U.S. blueberry imports, representing over half of all imports between 2008 and 2013. Since then, new markets have emerged and captured an increasing share of the U.S. blueberry import market. Peru and Mexico, for the first time, combined in 2018 to export more blueberries to the United States than Chile. This, coupled with additional imports from countries such as Canada and Argentina, brought Chile’s share of U.S. blueberry imports to its lowest levels since 2005, at 38 percent. Sourced mainly from the Southern Hemisphere, the majority of blueberry imports occurs during the off-season for domestic production. The U.S. production season begins in April and runs through the summer into early fall. This chart appears in the bi-annual ERS Fruit and Tree Nuts Outlook newsletter released in March 2019.