
Nearly 9 in 10 U.S. households use their own car for their primary grocery shopping
- by Brandon J. Restrepo
- 5/15/2019
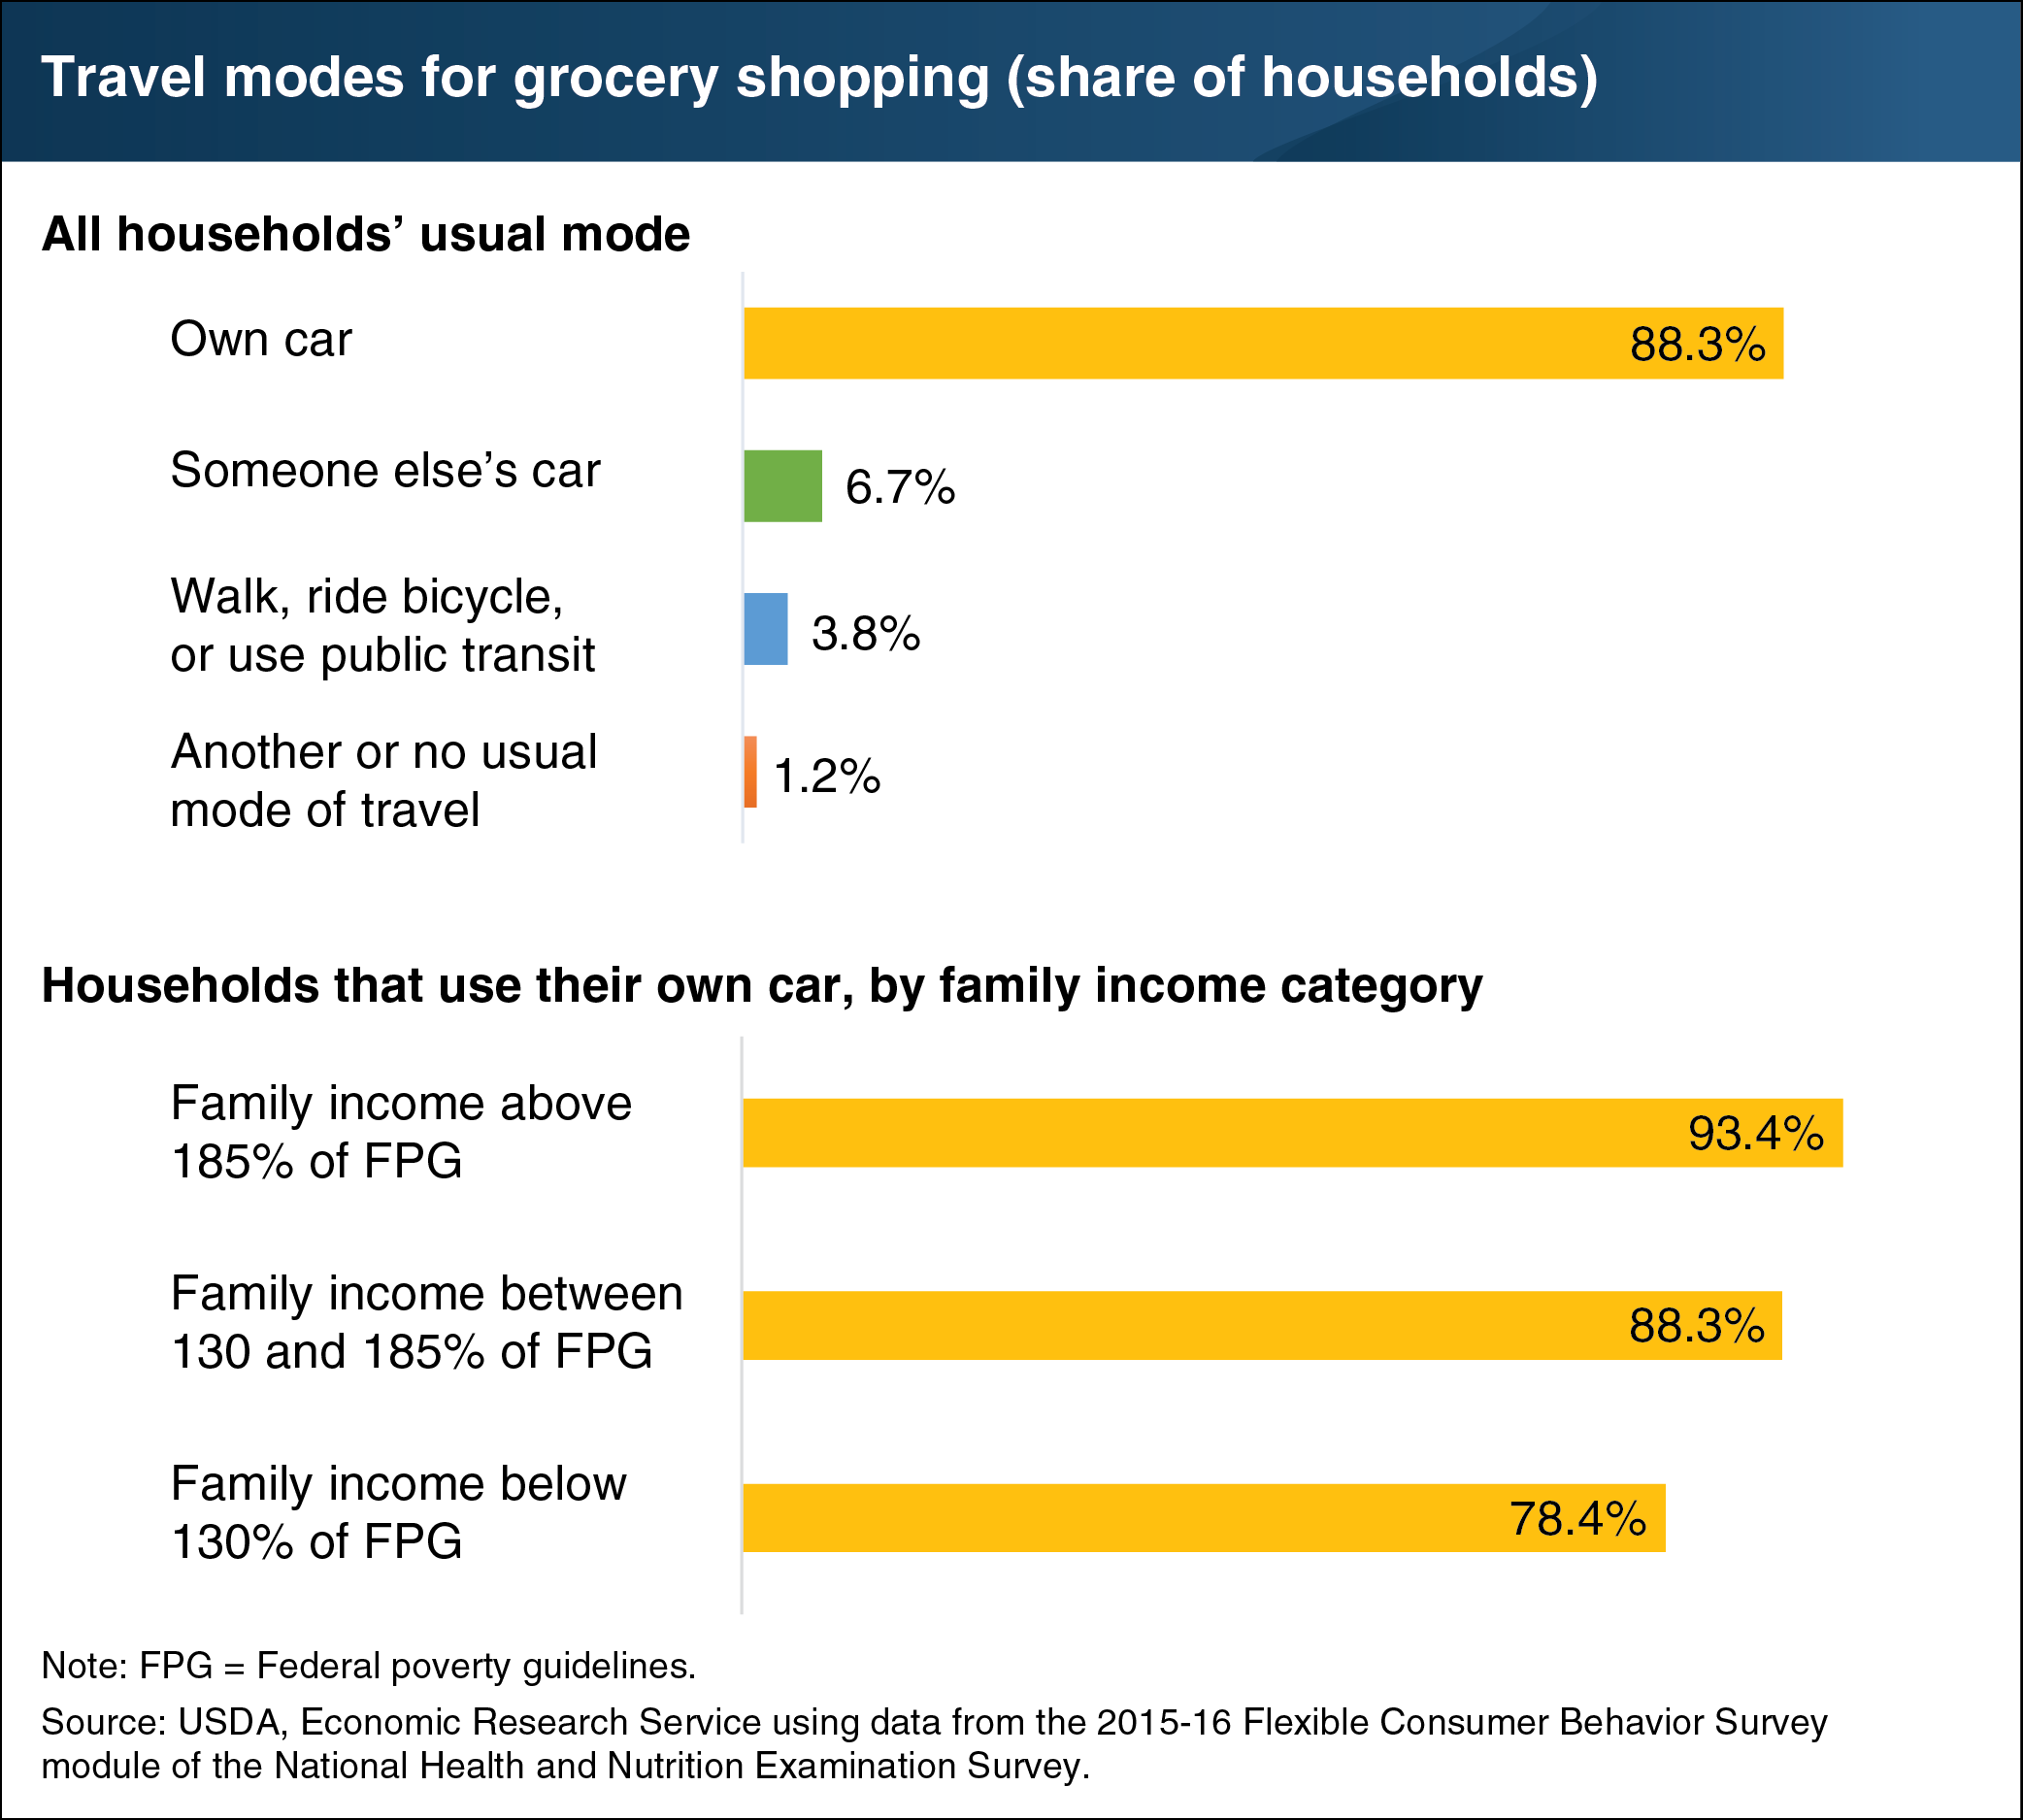
ERS developed the Flexible Consumer Behavior Survey (FCBS) module of the National Health and Nutrition Examination Survey to collect data on the dietary knowledge, attitudes, and habits of U.S. consumers. The ease and expense of travelling to grocery stores could affect the variety of perishable foods eaten at home or the choice to prepare a meal at home or dine out. According to 2015-16 FCBS module data, 88.3 percent of households usually drove their own cars to the stores where they did most of their grocery shopping. However, this figure masked differences by family income: While 93.4 percent of households with incomes above 185 percent of Federal poverty guidelines usually drove their own cars to do most of their grocery shopping, the percentage of households below 130 percent of poverty guidelines that usually used this mode of transportation was 78.4 percent. The survey found that 6.7 percent of households usually relied on someone else’s car when traveling to the store where they primarily shopped for groceries; only 3.8 percent usually walked, rode a bicycle, or used public transit. The remaining households (1.2 percent) had another or no usual mode of travel. More information from the FCBS can be found in the Food Consumption & Demand topic page on the ERS website.