
U.S. agricultural export value rose in 2018, but growth was limited by lower oilseed and oilseed product exports
- by Alex Melton
- 5/13/2019
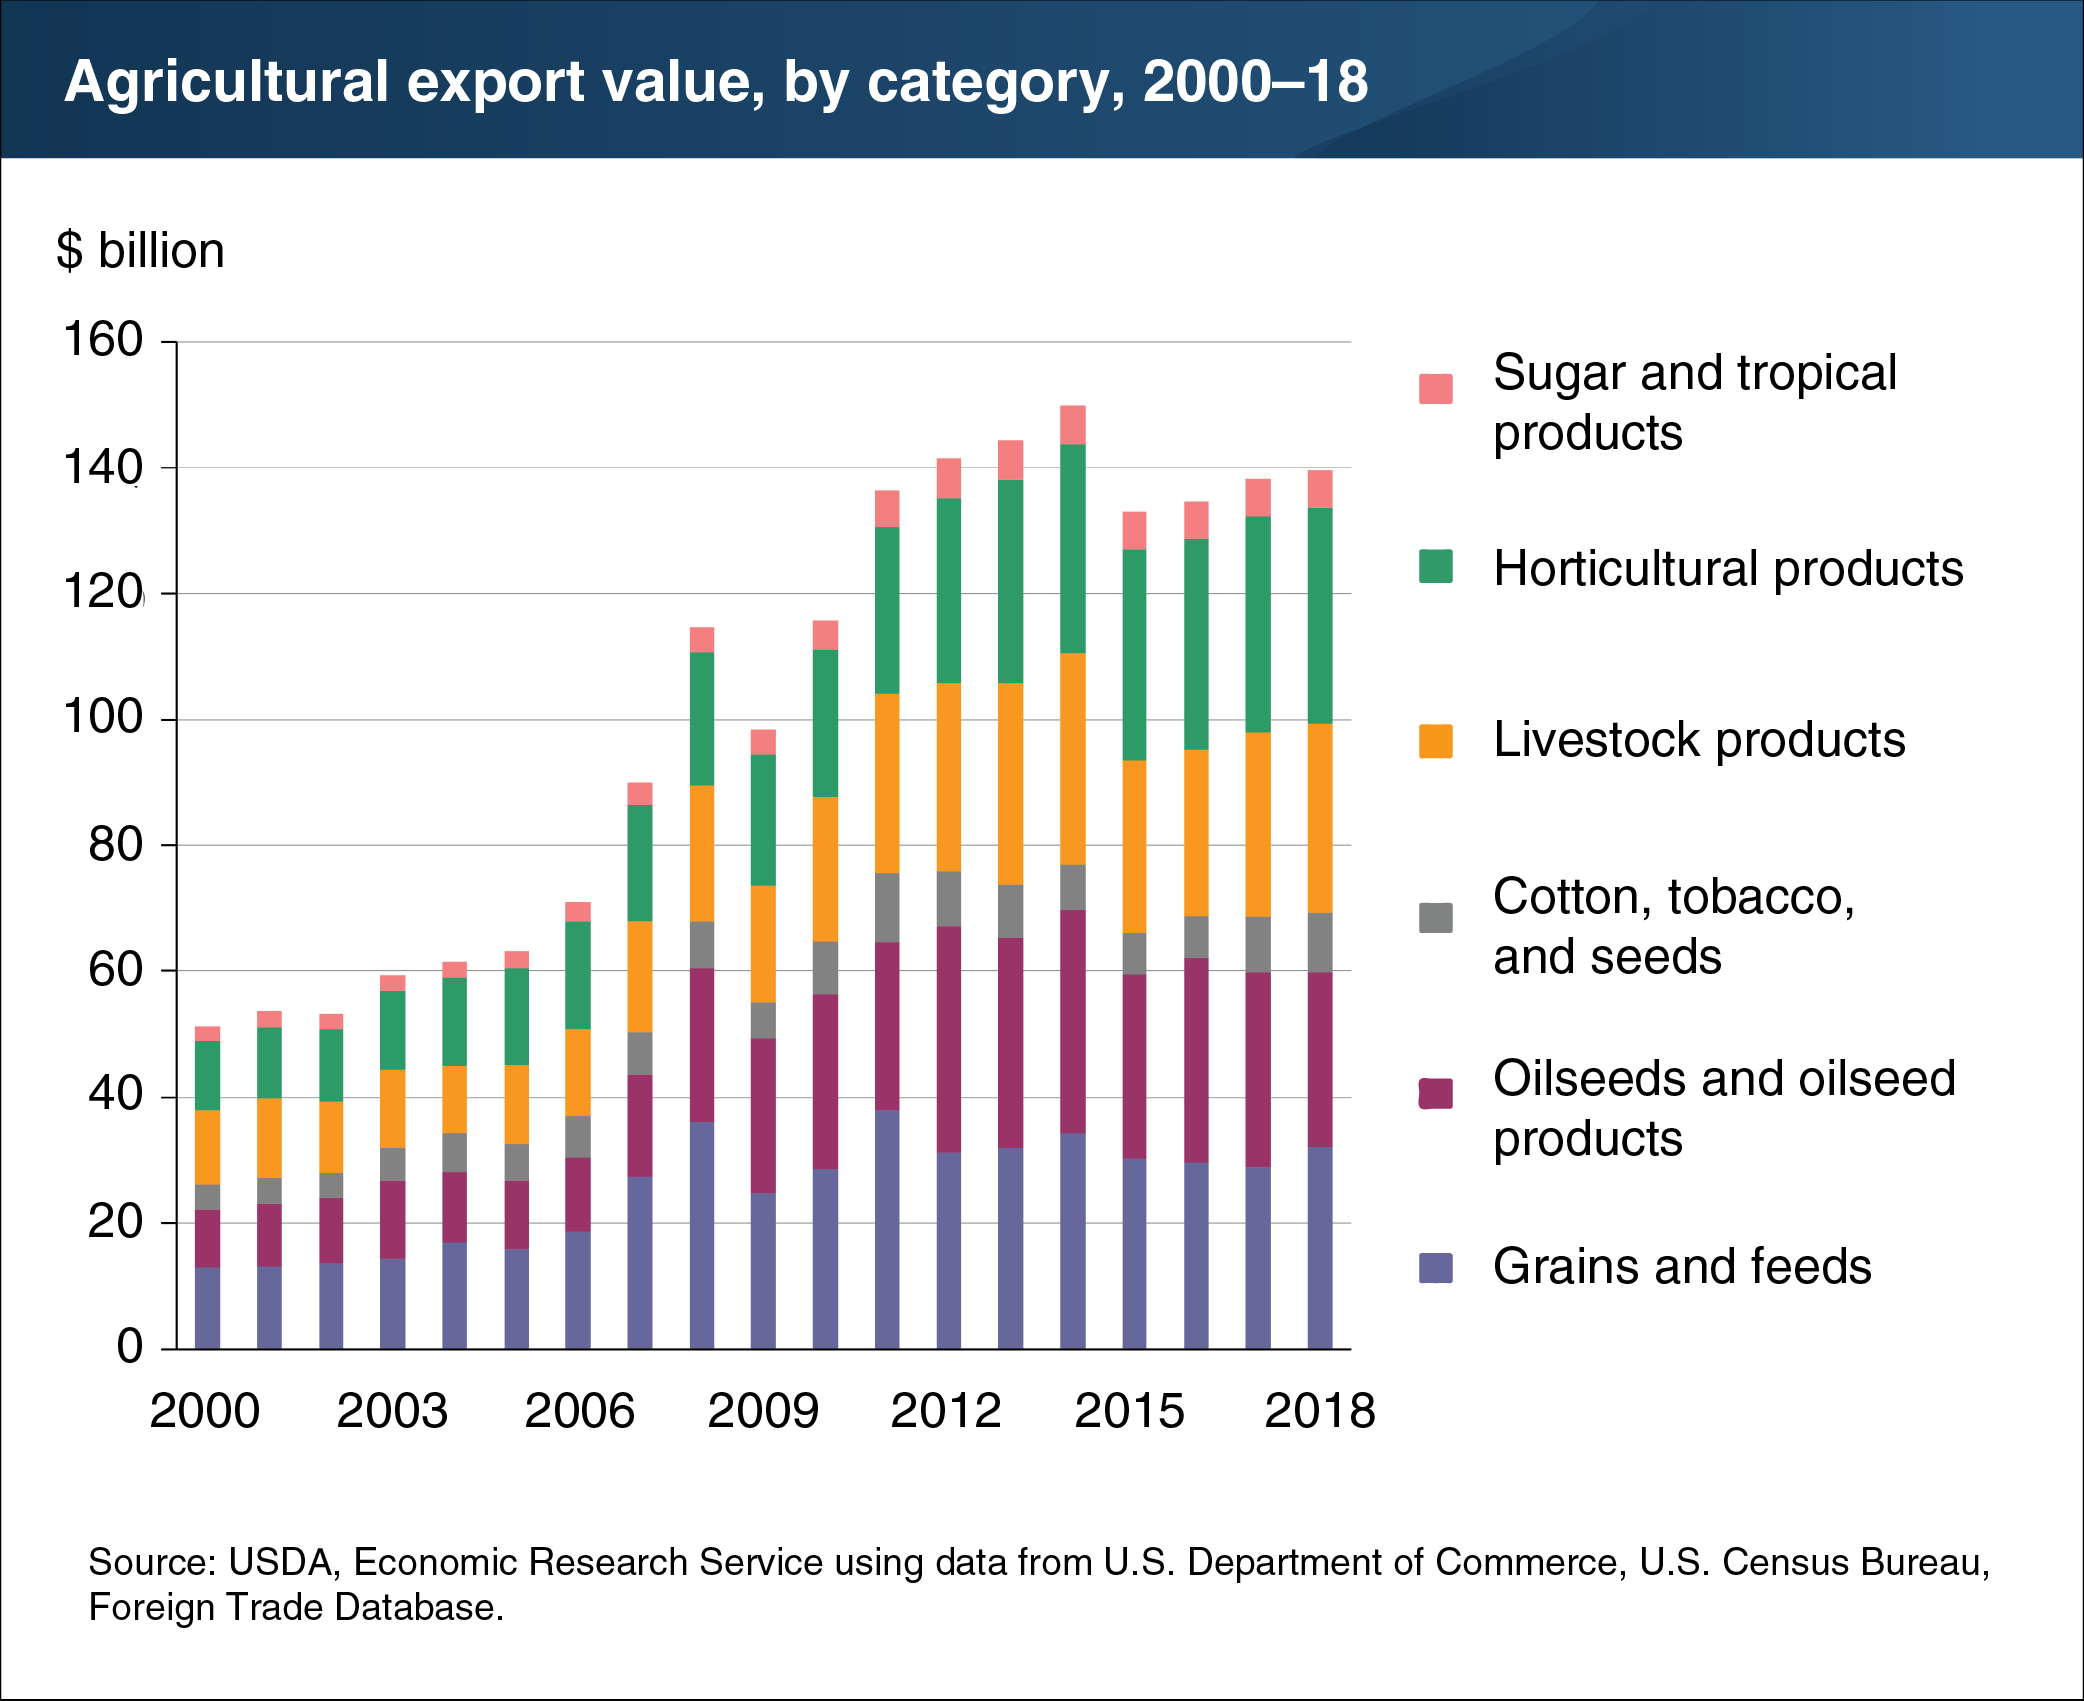
The value of U.S. agricultural exports increased slightly in 2018, driven by gains in all major commodity groups except oilseeds and oilseed products. Overall, U.S. agricultural exports were valued at $139.6 billion. Total growth was limited by an 11 percent decline in oilseed and oilseed product exports in 2018 compared to 2017. The decline in oilseed and oilseed product exports appears to be linked to soybean import tariffs imposed by China for U.S.-sourced soybeans as part of broader U.S.-China trade disputes. With the 2018 decline, oilseed and oilseed product exports fell to the fourth largest export category after ranking second in 2016 and 2017. As a share of total export value in 2018, horticultural product exports represented the largest category with $34.2 billion—or 24 percent of total agricultural exports. Second to horticultural exports in total value was grains and feeds at $32.1 billion. Grains and feeds, which includes corn, had the largest year over year increase in export value at 11 percent. This chart appears in the Agricultural Trade section of the ERS data product, “Ag and Food Statistics: Charting the Essentials,” updated in April 2019.