
Food accounted for 12.9 percent of household spending in 2017
- by Annemarie Kuhns
- 12/13/2018
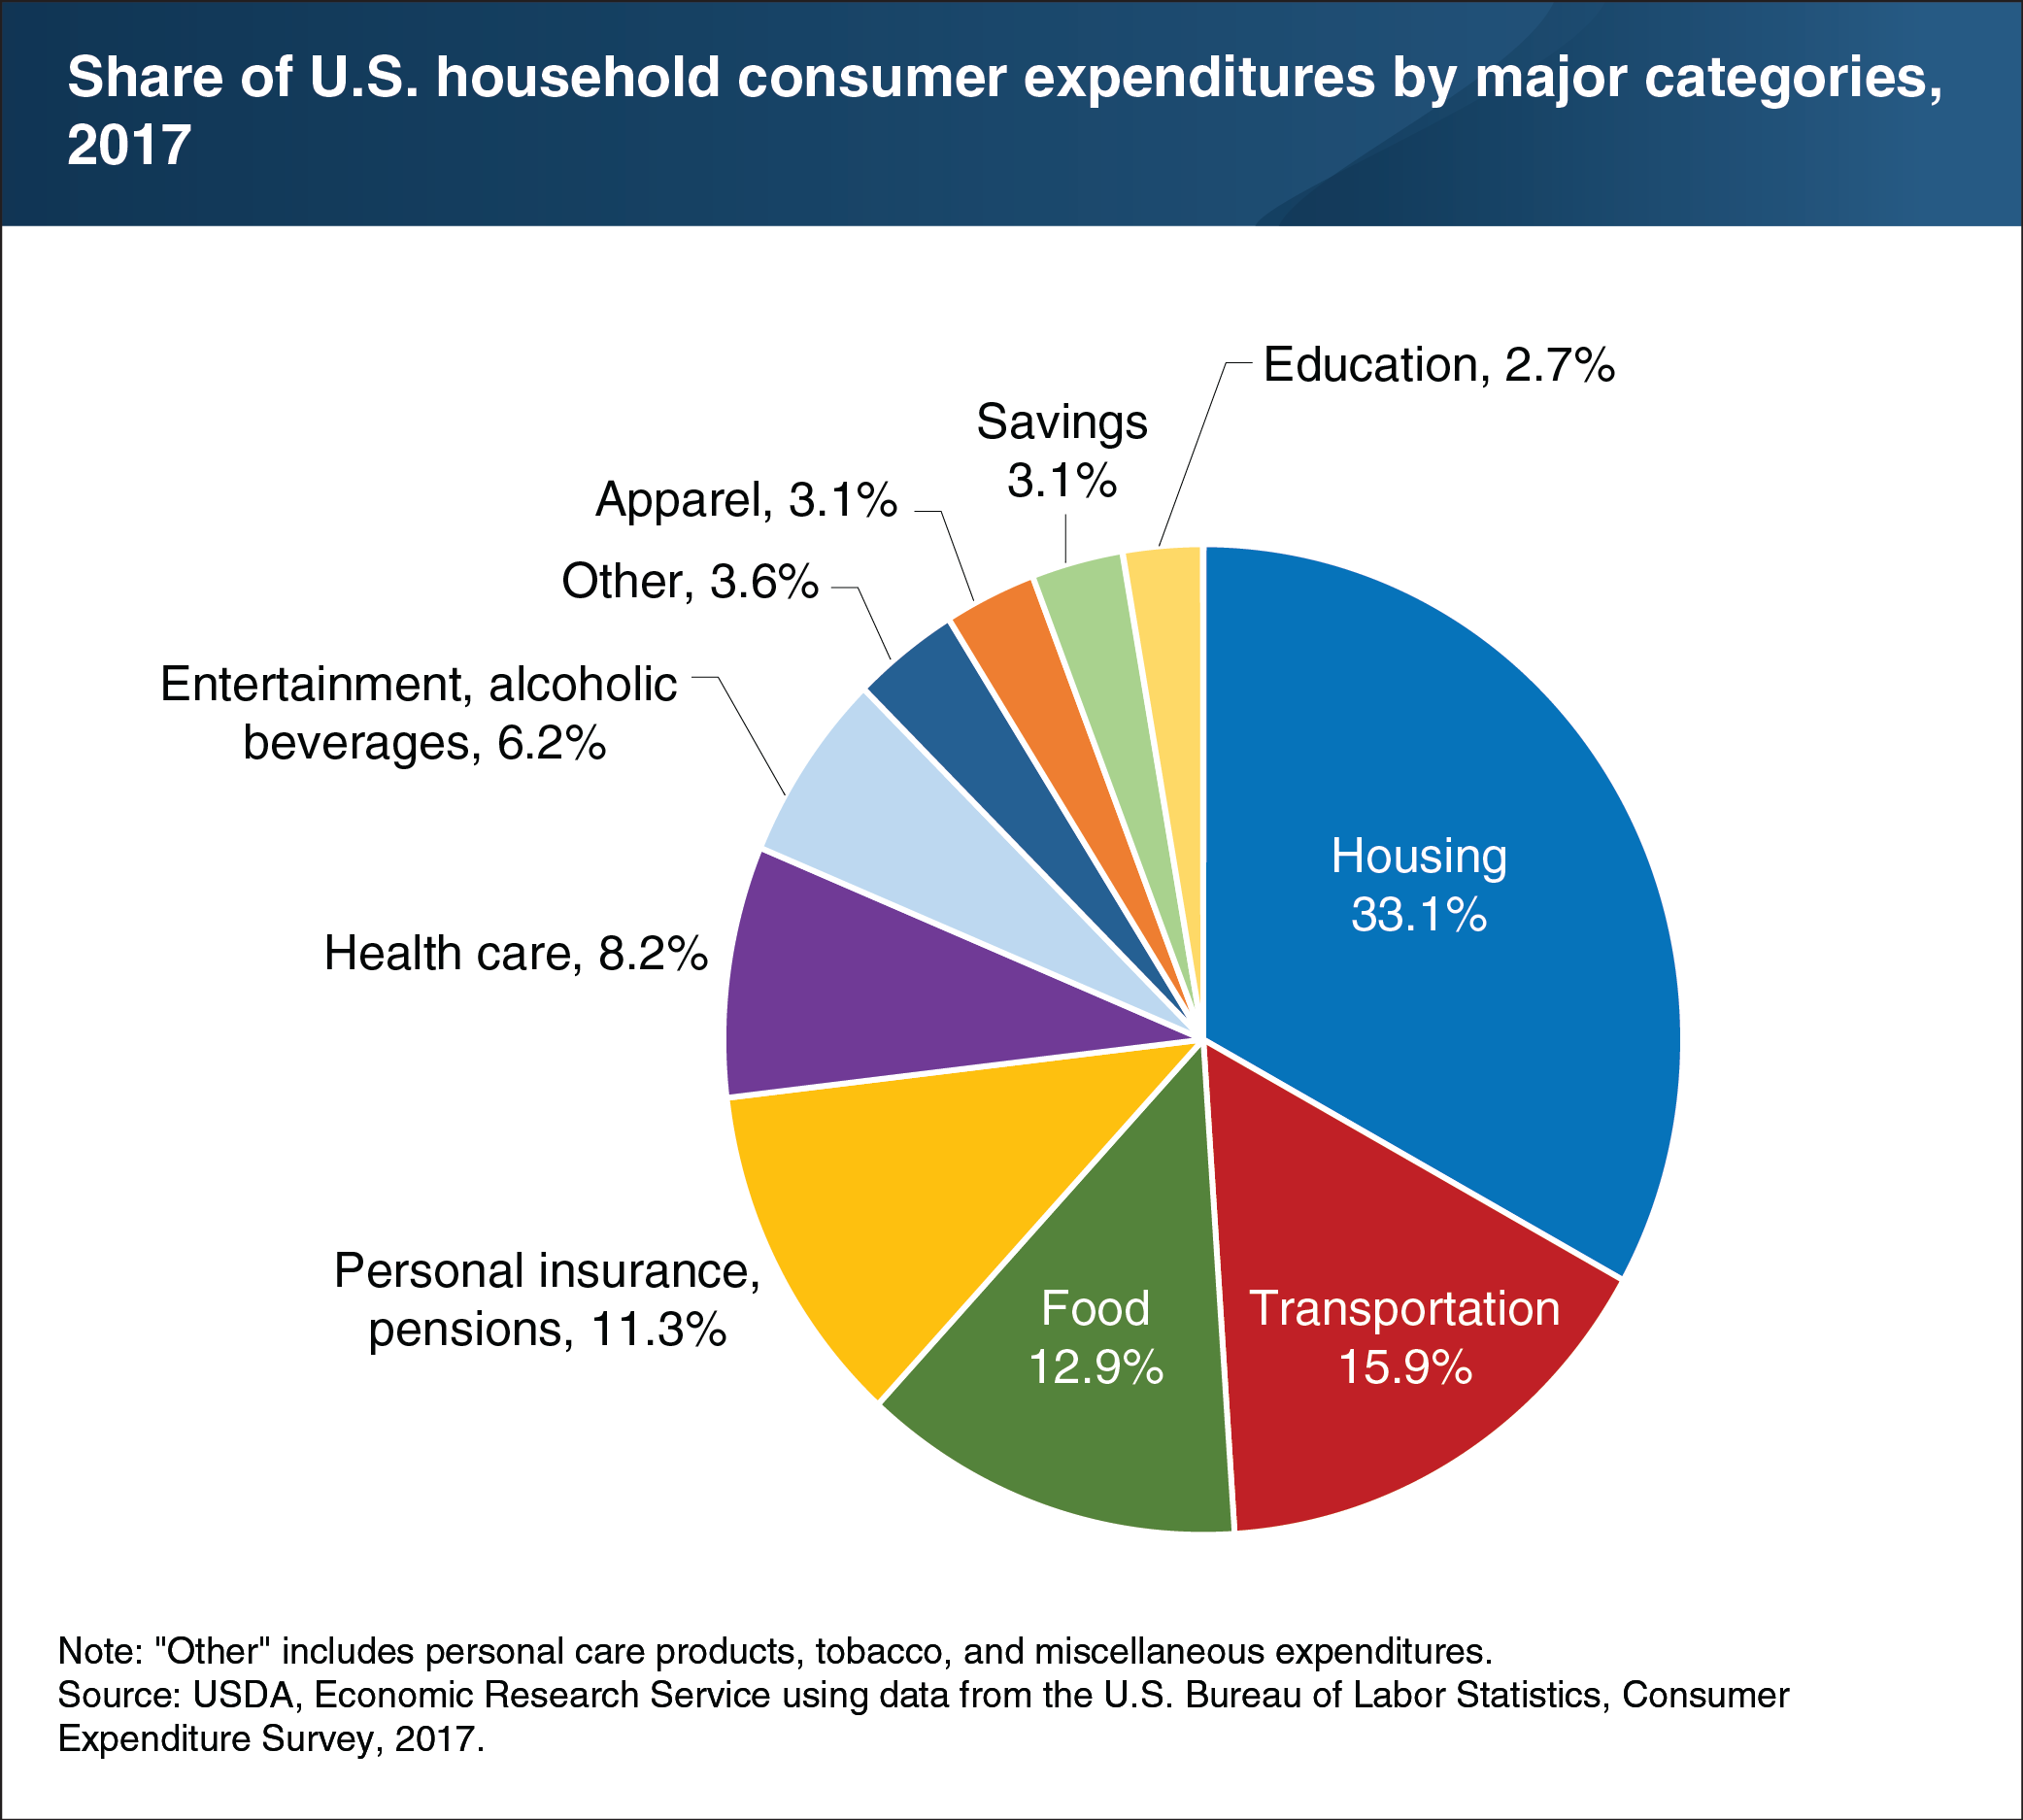
The average American household spent a slightly larger share of its budget on total food—both groceries and restaurant purchases—in 2017 than in 2016. The increase from 12.6 percent of total expenditures in 2016 to 12.9 percent of expenditures in 2017, possibly reflects the 0.9-percent increase in total food prices, combined with decreased expenditure shares for savings and for personal insurance and pensions. With a 12.9- percent share, food ranked third in 2017—behind housing (33.1 percent) and transportation (15.9 percent)—in a typical American household’s expenditures. Breaking down the 2017 food share, the average household spent 7.3 percent of its total budget (57 percent of its food budget) at grocery stores and 5.6 percent of its total budget (43 percent of its food budget) at restaurants. Looking at expenditure shares over time, food’s share had been declining since 1984 (the first year of available data), when food expenditures had accounted for 15 percent of consumer spending. However, for the last 2 years, food’s share of the total budget has increased from 12.5 percent in 2015. This chart can be found in the ERS publication, Selected charts from Ag and Food Statistics: Charting the Essentials, October 2018.