
The composition of U.S. agricultural exports, by category, remained relatively stable in 2000-17
- by Alex Melton
- 11/26/2018
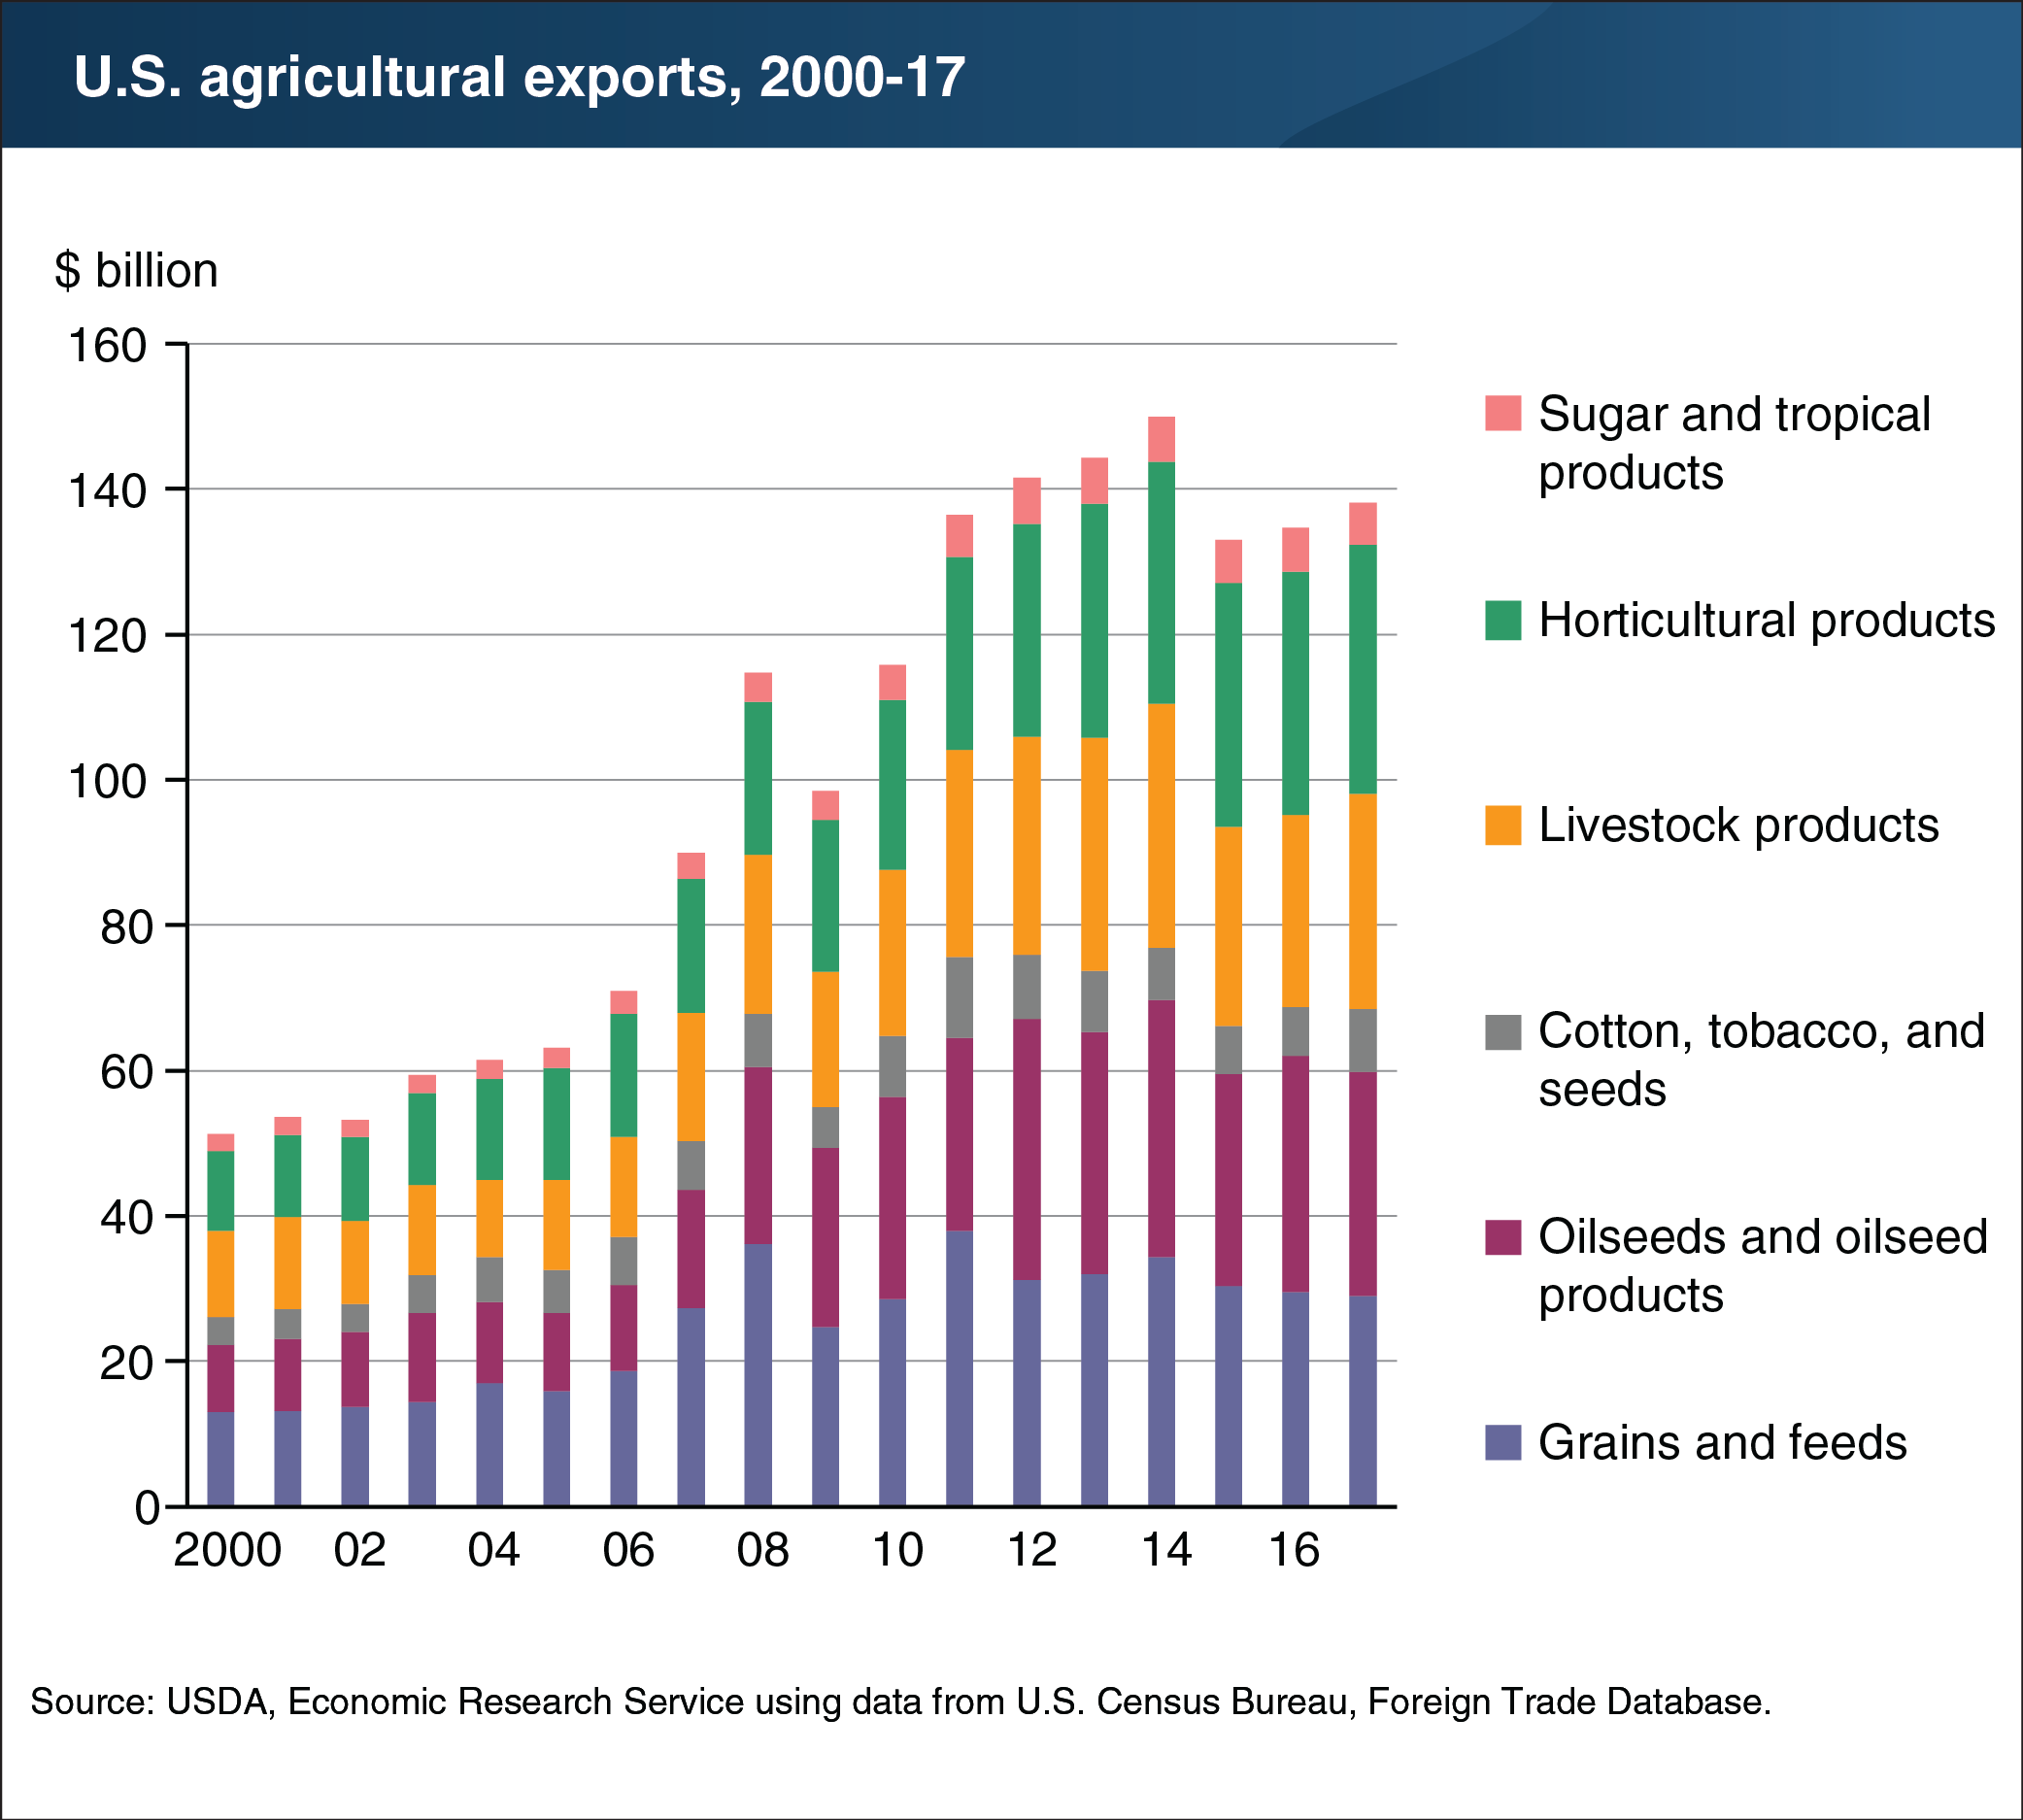
The United States exports a variety of agricultural products to destinations around the world. Although the total value of agricultural exports rises and falls depending on market and economic conditions, the shares of individual export categories within that total are generally more stable. The highest valued export product categories include horticultural products (like fruits and vegetables), oilseeds and oilseed products, livestock products, and grains and animal feeds. However, these top categories have trended differently in terms of value over time. In recent years, the value of grains and animal feeds has fallen by 5 percent, reducing its share of total agricultural exports from 23 percent to 21 percent since 2015. The other top commodity groups have risen in value since 2015, but their shares have remained stable due to overall growth in agricultural export value. Among the lower valued commodity groups, the cotton, tobacco, and seeds category has grown significantly since 2015, rising by 31 percent in value and increasing its share of total agricultural exports from 5 percent to 6 percent. This chart appears in the ERS report, "Ag and Food Statistics: Charting the Essentials, October 2018.”