
U.S. spending on food away from home continued to outpace food-at-home spending in 2017
- by Howard Elitzak
- 9/25/2018
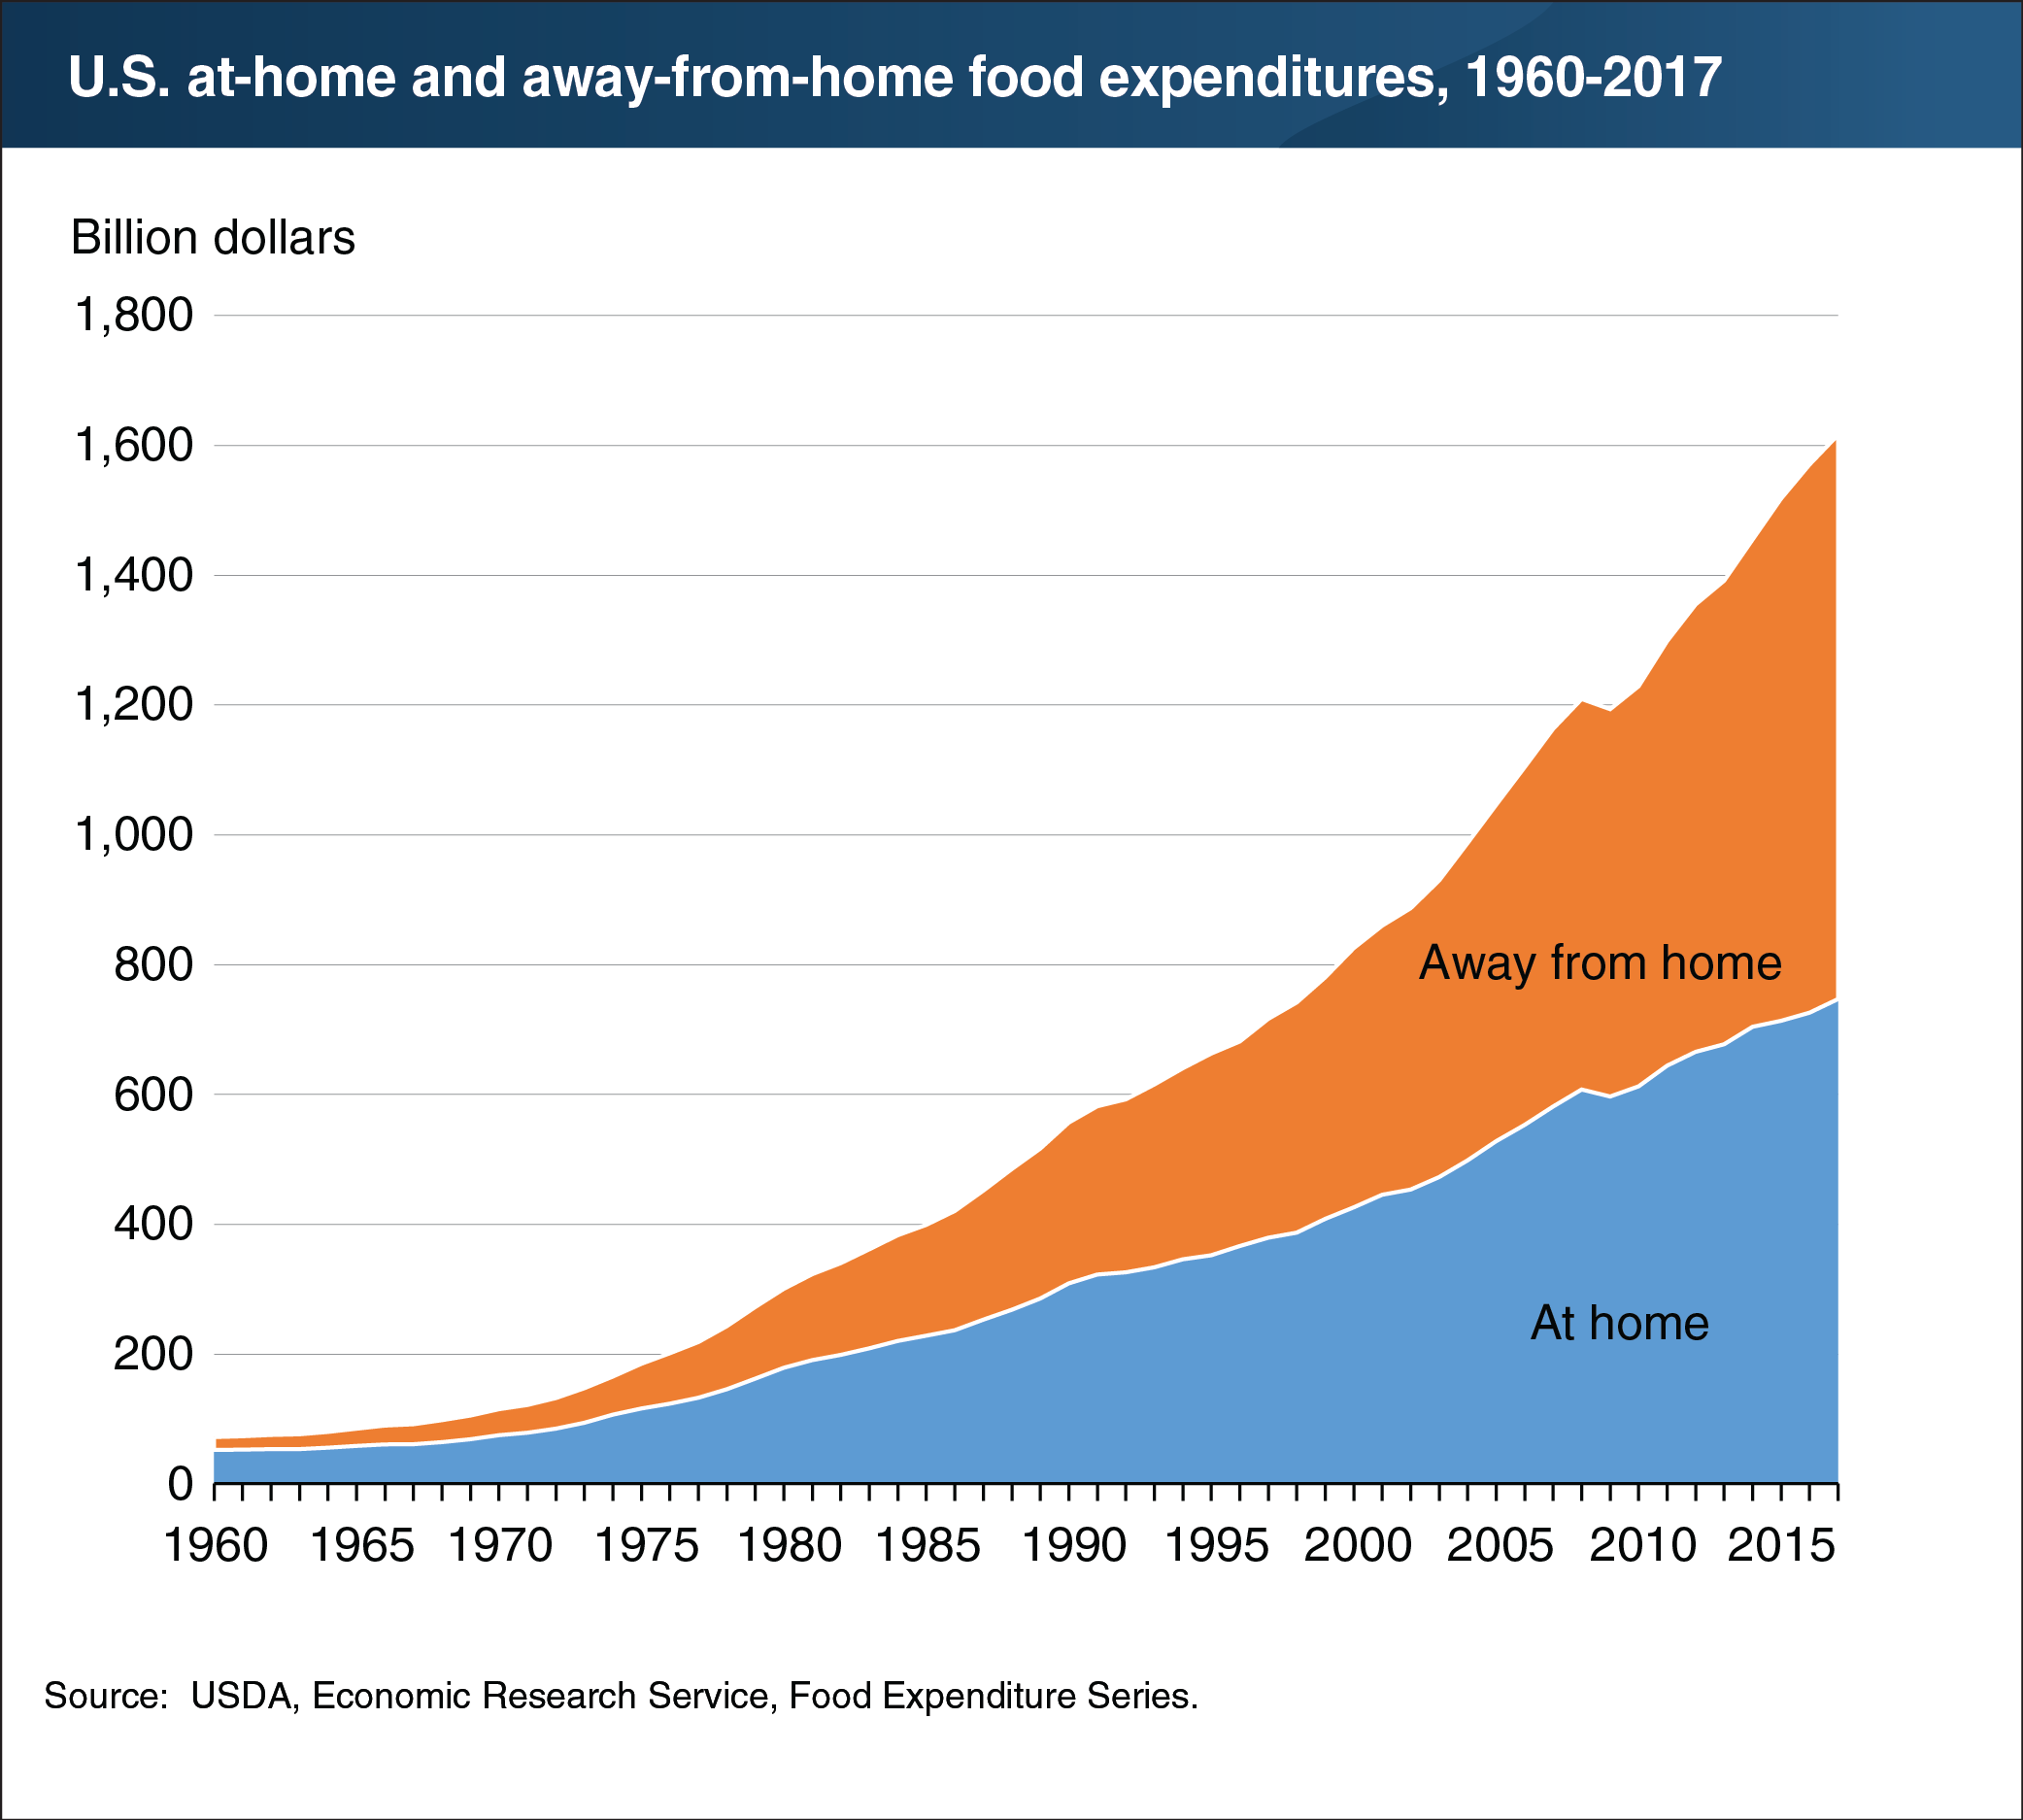
U.S. consumers, businesses, and government entities spent $1.62 trillion on food and beverages in 2017. Spending at food-away-from-home establishments—restaurants, school cafeterias, sports venues, and other eating places—accounted for 53.8 percent of these expenditures, and the remaining 46.2 percent took place at grocery stores, supercenters, convenience stores, and other retailers. A 53.8-percent share of food expenditures does not equate to 53.8 percent of food quantities, as food purchased away from home is generally higher priced than food prepared at home. Food-away-from-home outlets incur costs for the workers required to prepare and serve food, as well as for buildings, equipment, and utilities. The away-from-home market, which accounted for about one-third of total food expenditures 50 years ago, saw its share grow through the decades, except in some recession years. During the 2007-09 recession, food away from home’s share of total food spending stayed at or just below 50 percent before surpassing its pre-recession share by rising to 50.2 percent in 2010 and continuing to grow to its 2017 share of 53.8 percent. The data for this chart are from the ERS report, Measuring the Value of the U.S. Food System: Revisions to the Food Expenditure Series, released on September 20, 2018.