
Close to 90 percent of U.S. consumers’ food and beverage spending is for domestically produced products
- by Michelle Saksena
- 5/14/2018
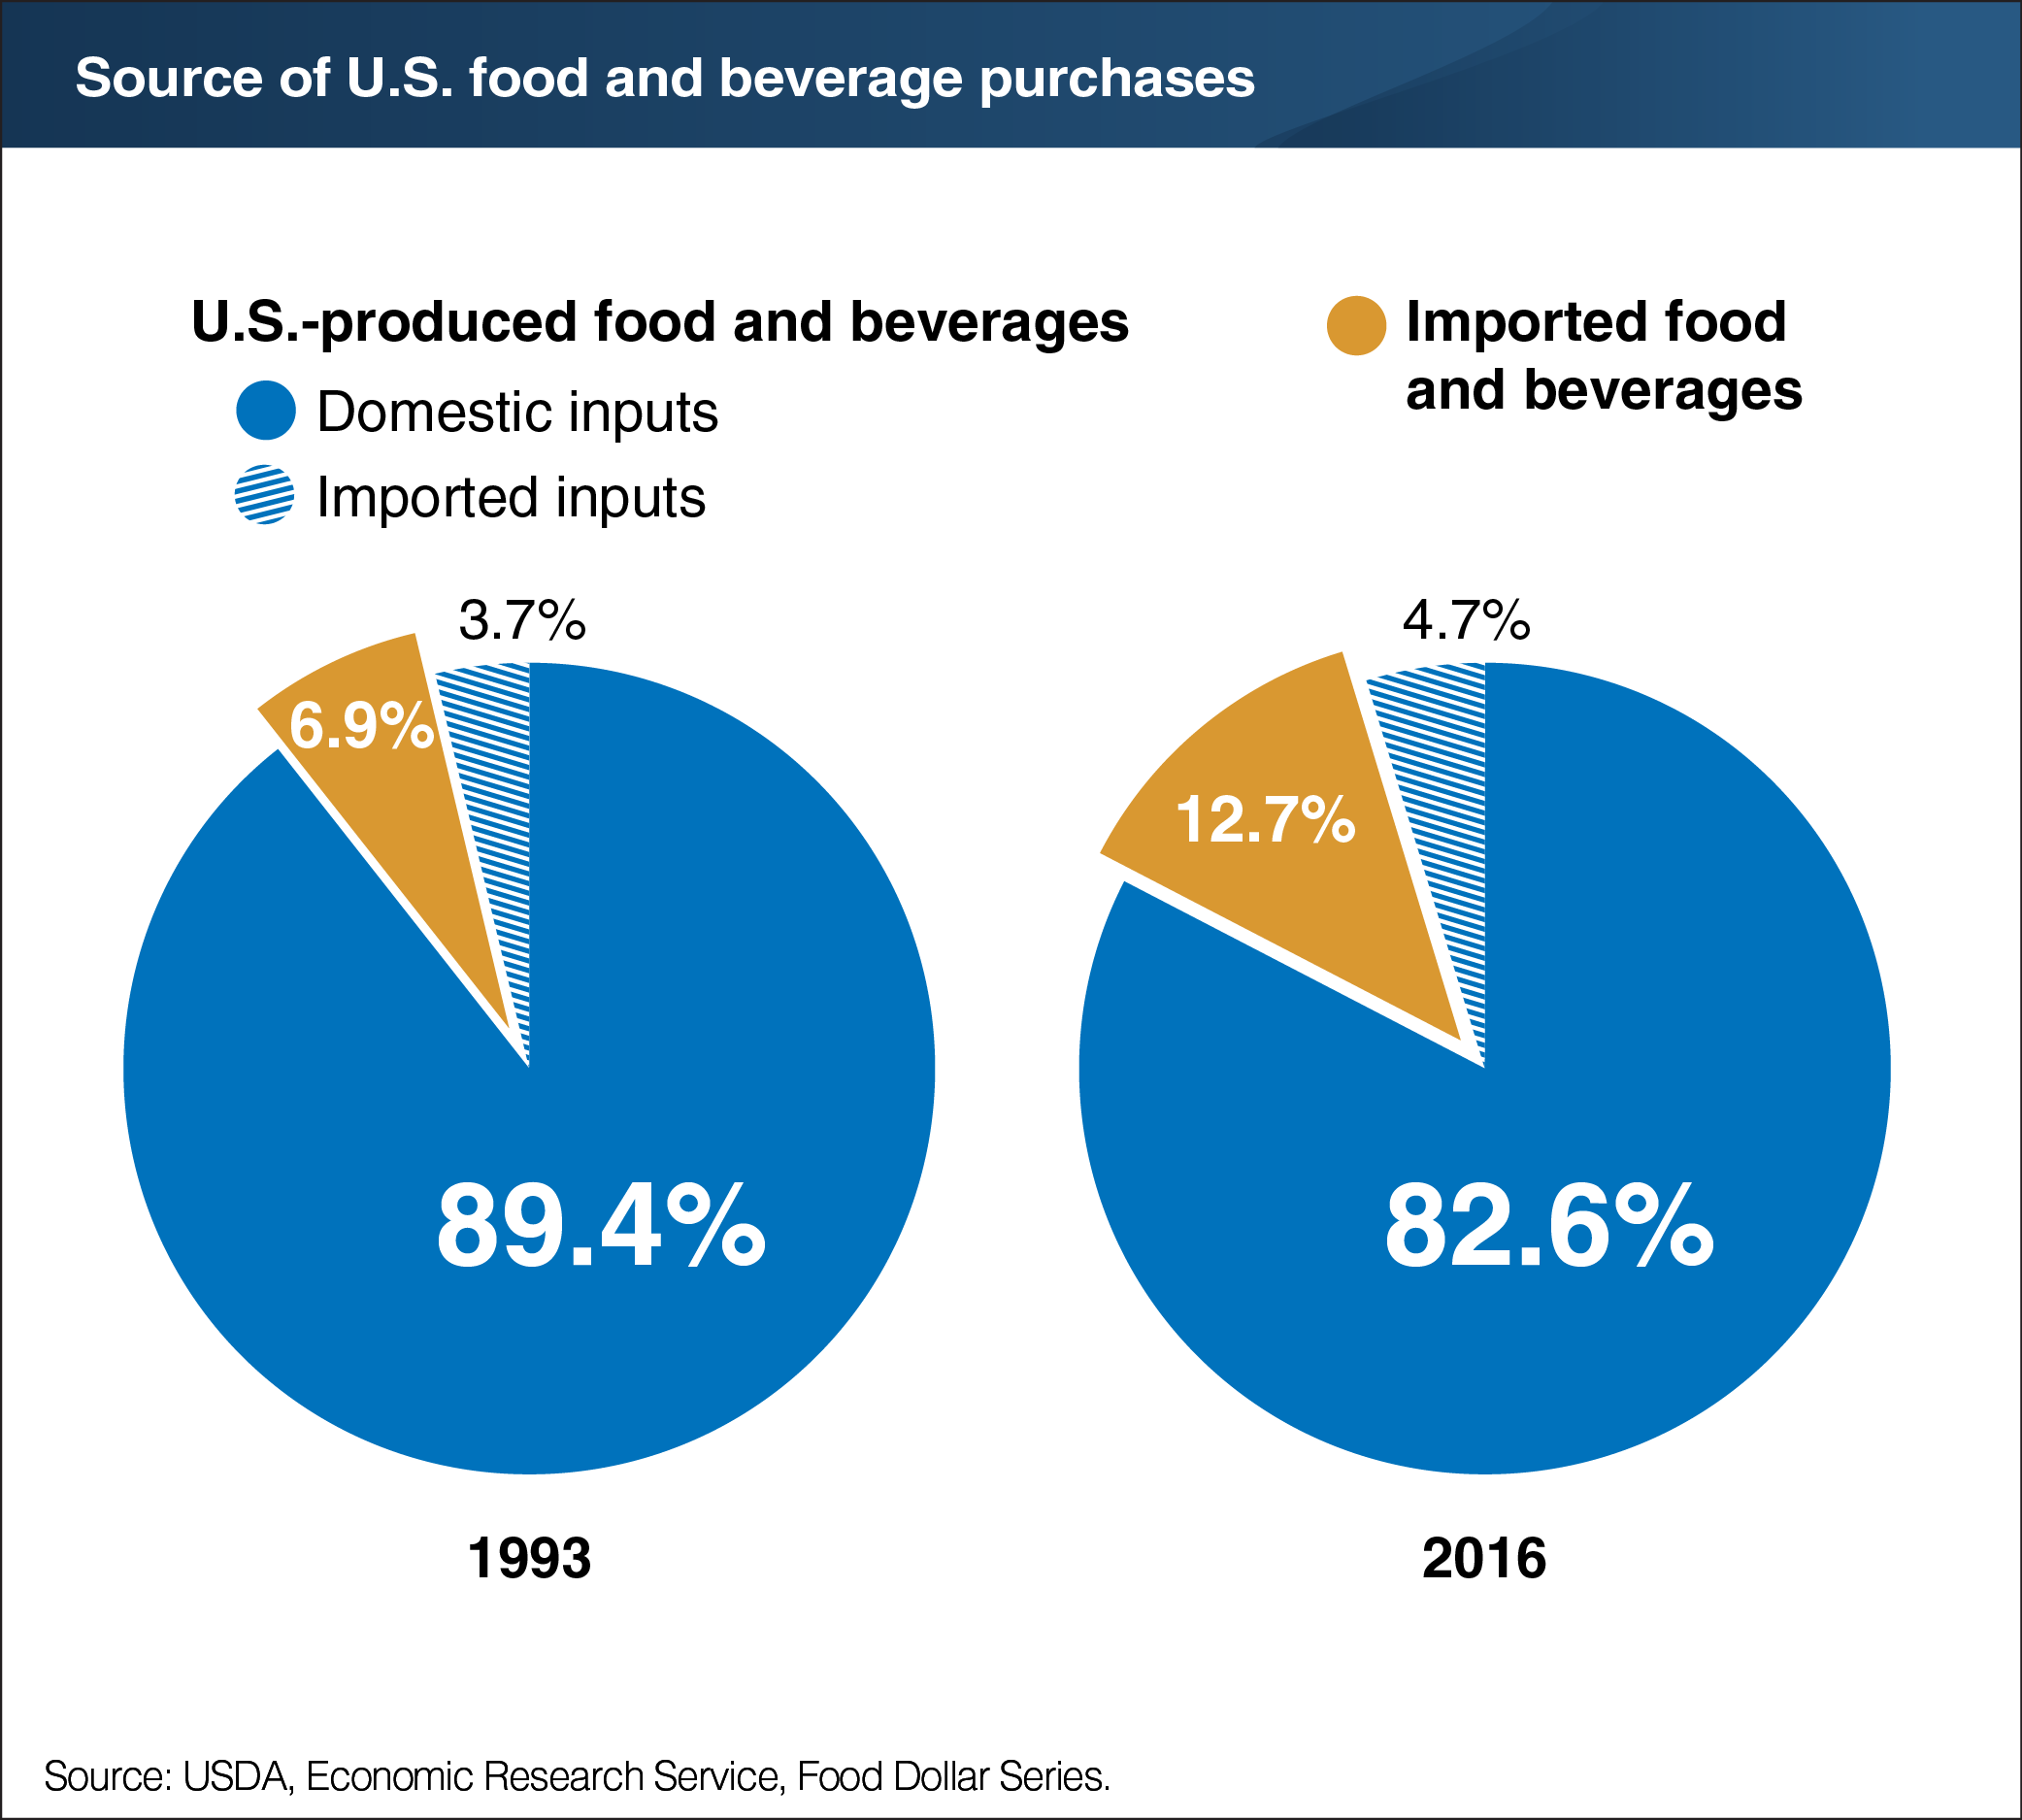
In 2016, 87.3 percent of food and beverage purchases by U.S. consumers, including both grocery store and eating out purchases, were from domestic production. The remaining 12.7 percent were imported food and beverages such as produce from Chile or wines from France. Imports’ share of the U.S. food and beverage dollar has almost doubled over the last two decades from 6.9 percent in 1993, due in part to growing demand by U.S. consumers for year-round fresh produce options and increasing global trade in food and beverages. Imported inputs are used in U.S. food and beverage production, and their share of the U.S. food and beverage dollar has also risen. Imported inputs used by U.S. food companies and restaurants include both food inputs, such as avocadoes from Mexico and cranberries from Canada, and non-food inputs such as natural gas and foreign-made restaurant equipment. In 2016, imported inputs used in domestically produced food and beverages accounted for 4.7 percent of the U.S. food and beverage dollar, up from 3.7 percent in 1993. The data for this chart are from ERS’s Food Dollar Series data product.