
Farm share of U.S. food dollar declined again in 2016
- by Patrick Canning and Michelle Saksena
- 4/12/2018
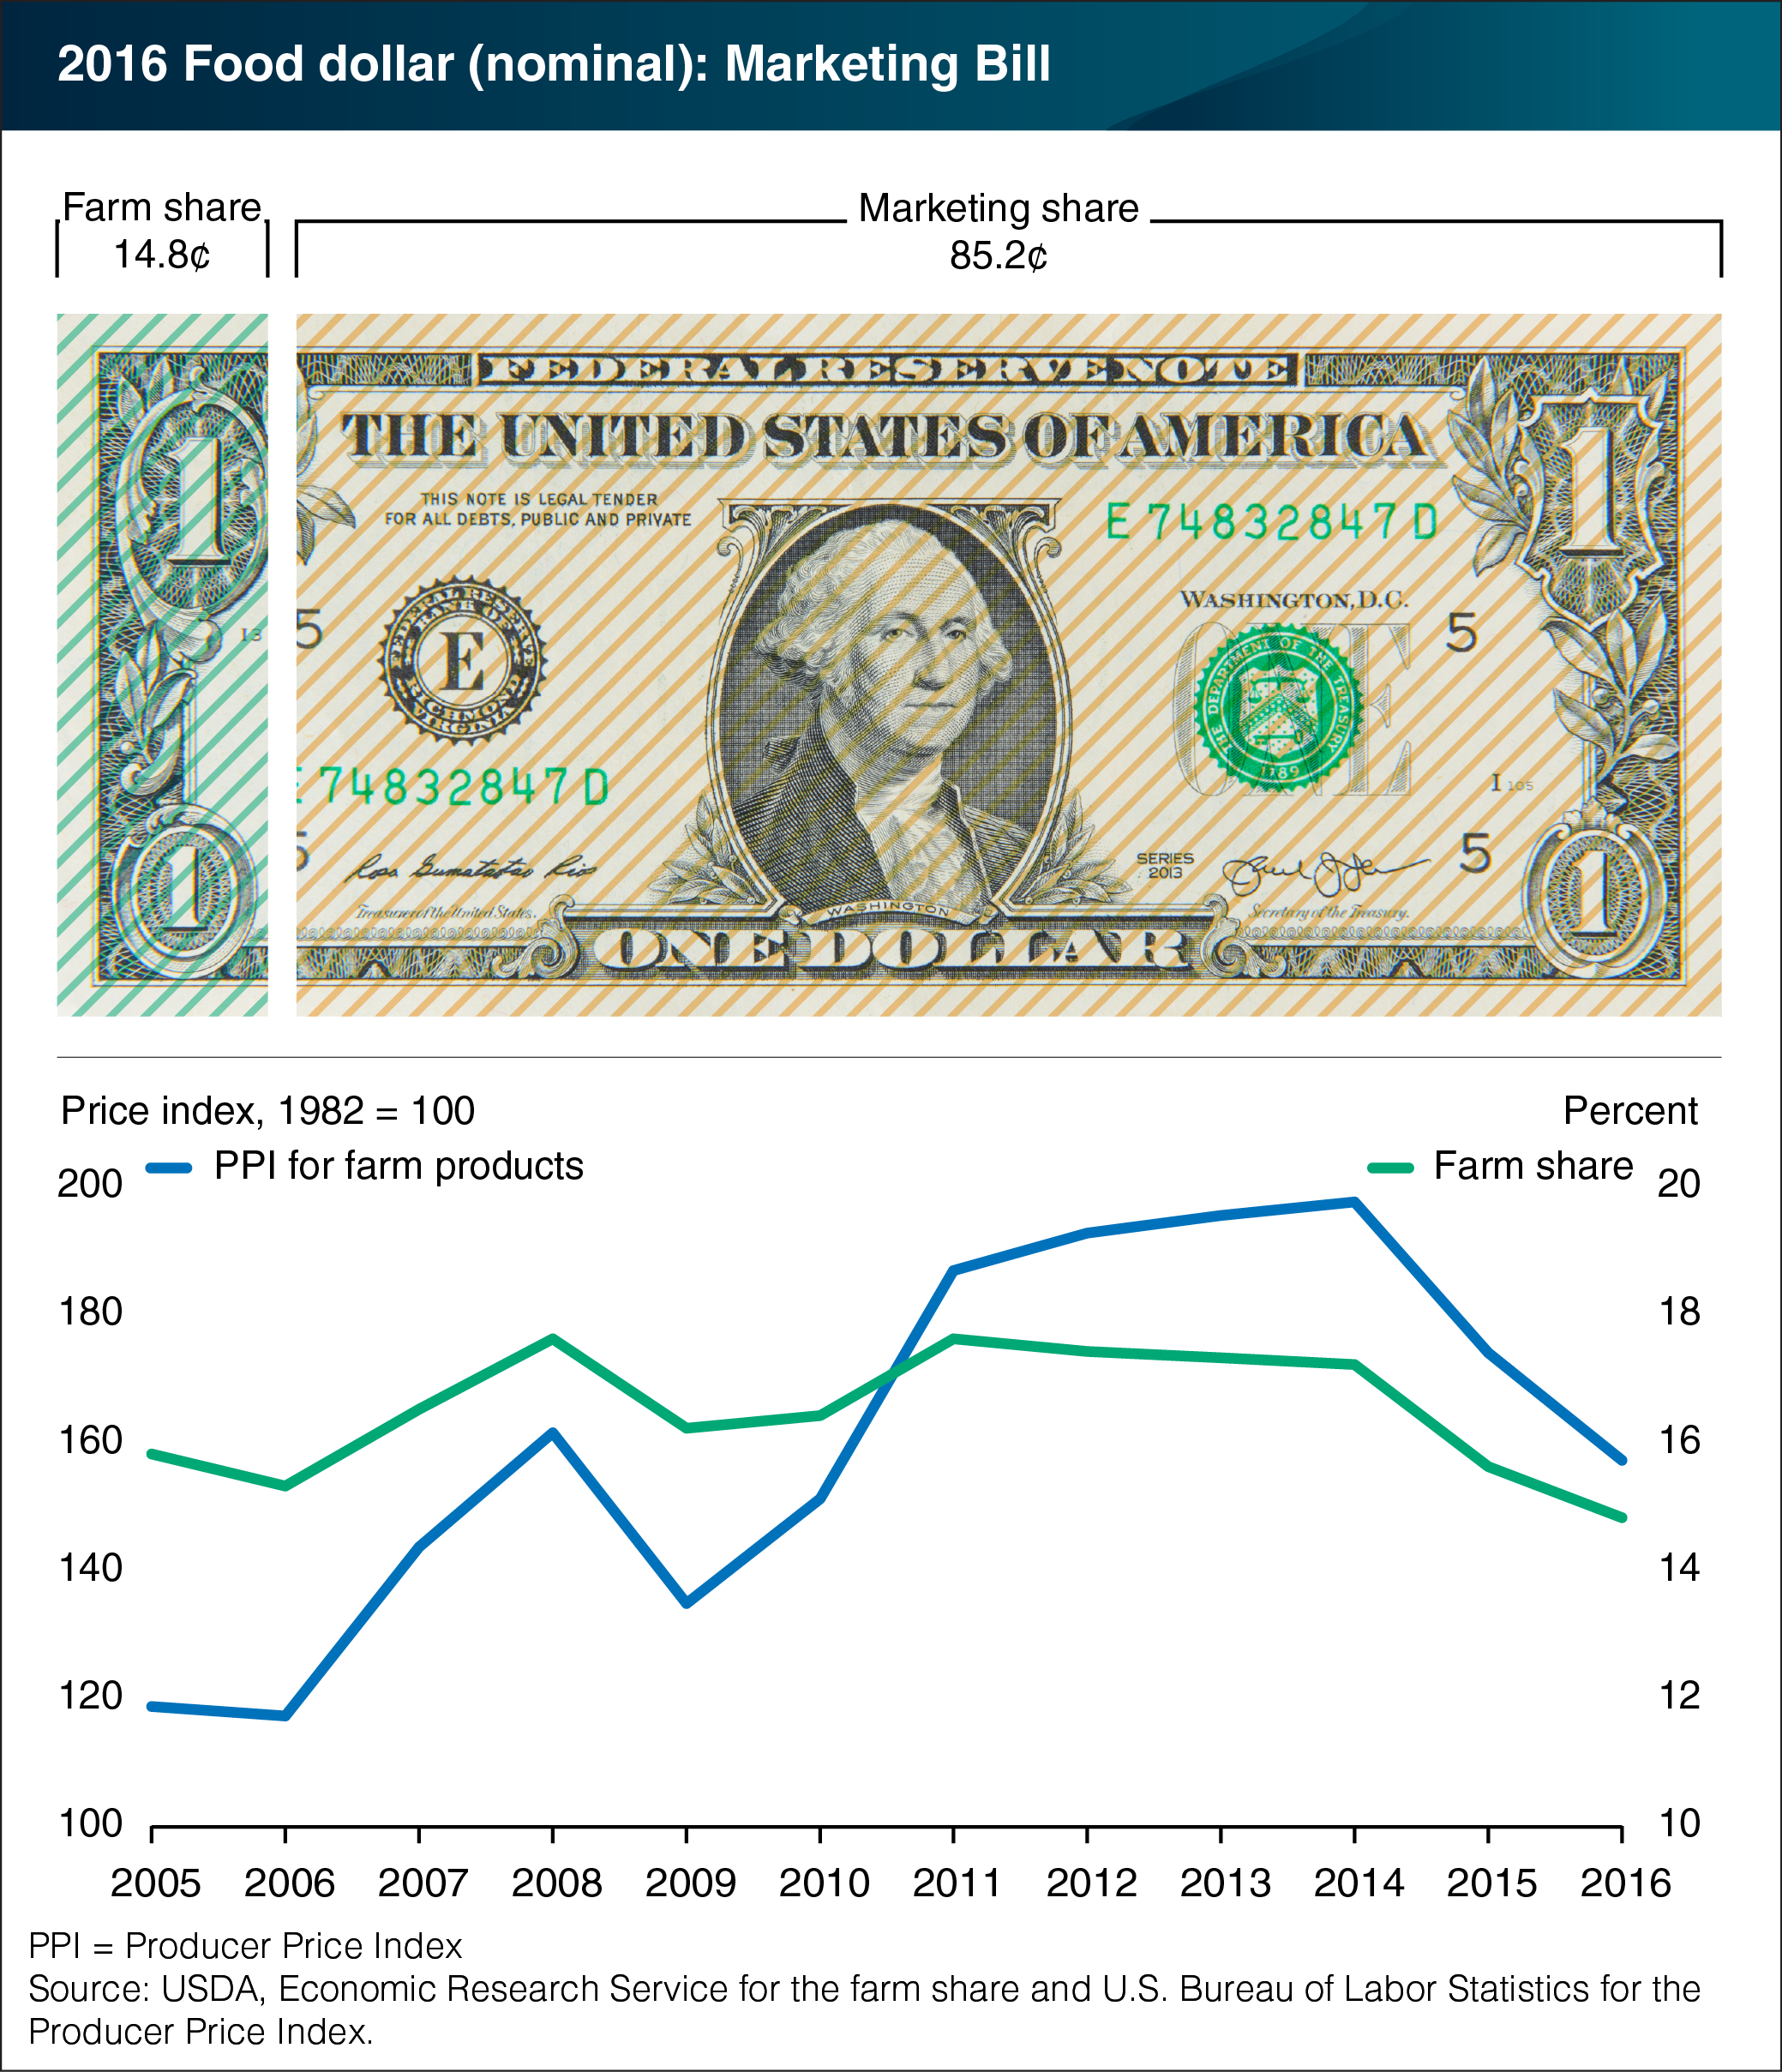
On average, U.S. farmers received 14.8 cents for farm commodity sales from each dollar spent on domestically-produced food in 2016, down from 15.5 cents in 2015. Known as the farm share, this amount is at its lowest level for the period 1993 to 2016, and coincides with a steep drop in 2016 average prices received by U.S. farmers, as measured by the Producer Price Index for farm products. ERS uses input-output analysis to calculate the farm and marketing shares from a typical food dollar, including food purchased at grocery stores and at restaurants, coffee shops, and other eating out places. 2016 was the fifth consecutive year that the farm share has declined, though the 4.5-percent drop in 2016 was below 2015’s 9.9-percent fall. The drop in farm share also coincides with five consecutive years of increases in the share of food dollars paying for services provided by the foodservice industry. Since farmers receive a smaller share from eating out dollars, due to the added costs for preparing and serving meals, more food-away-from-home spending will also drive down the farm share. The data for this chart can be found in ERS’s Food Dollar Series data product, updated on March 14, 2018.