
The regional composition of U.S. imports has remained stable over time
- by Jayson Beckman and Kari E.R. Heerman
- 1/30/2018
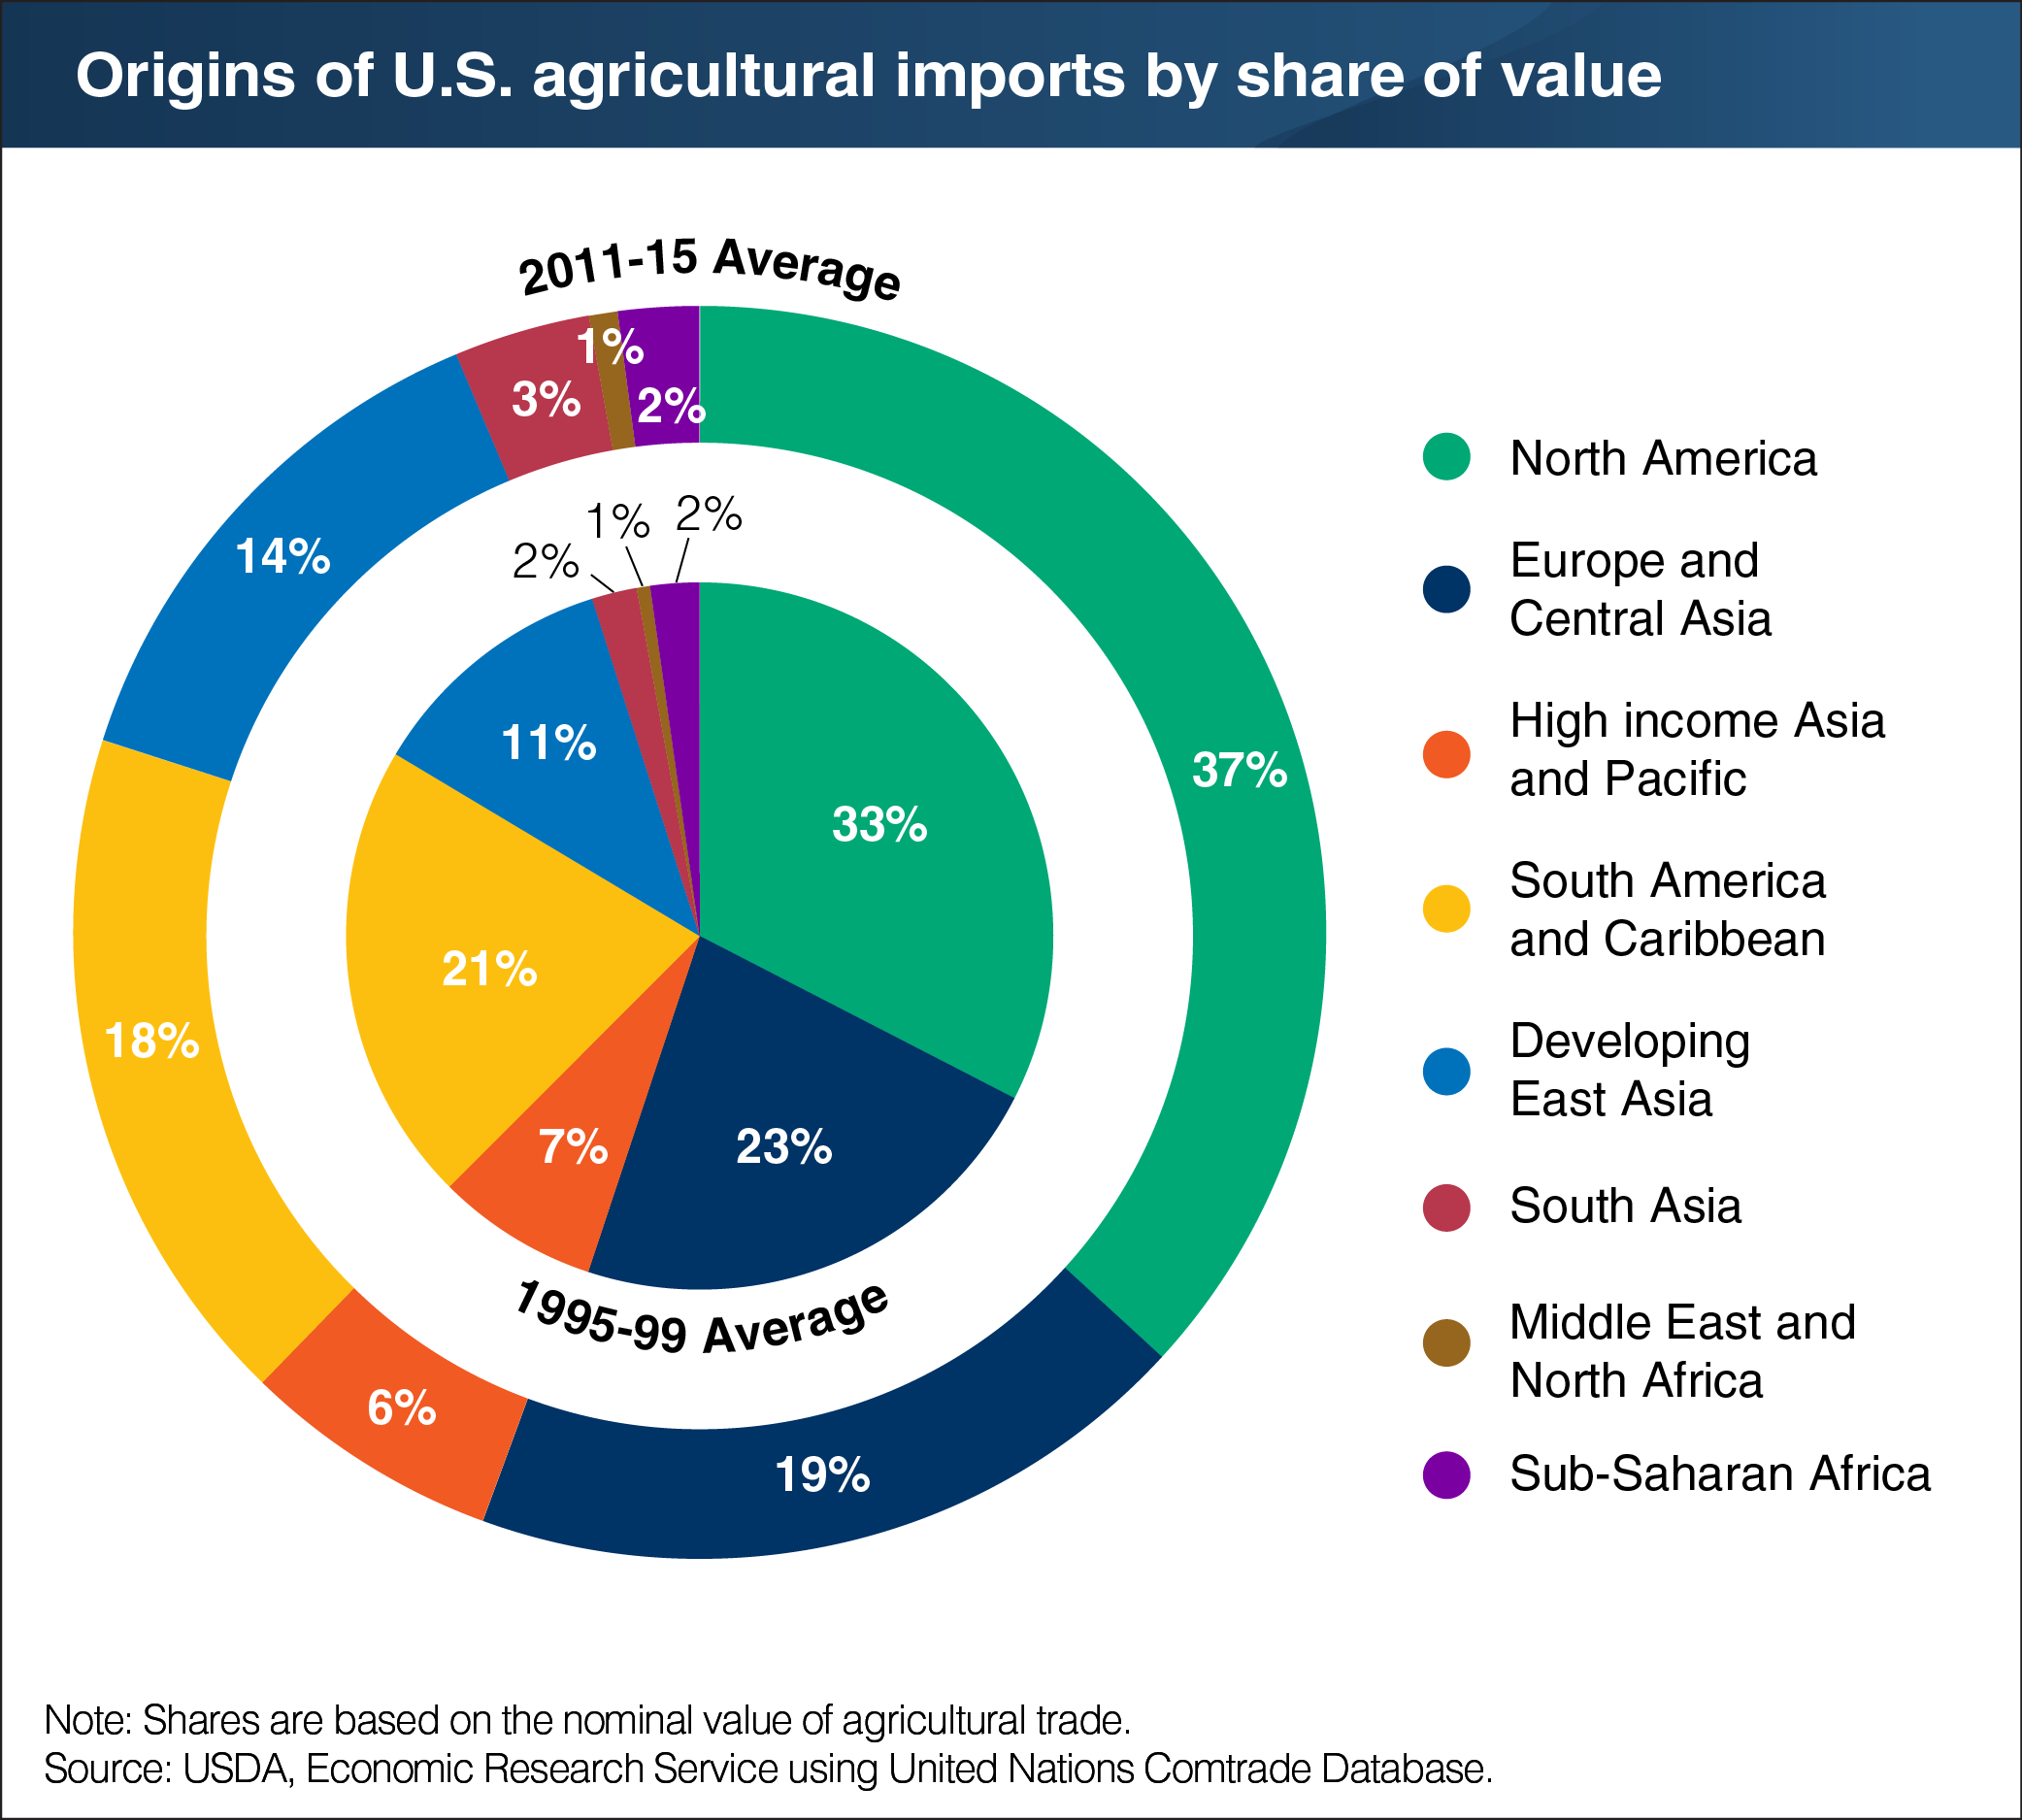
The share of U.S. agricultural imports from regions consisting primarily of developed economies remained stable from 1995 to 2015, at just over 60 percent. This contrasts with the destinations for U.S. agricultural exports, which shifted further toward developing regions. There was a compositional shift in import shares, however, from one developed region to another. In particular, a decline in the share of U.S. agricultural imports supplied by Europe was offset almost exactly by an increase in the share supplied by Canada and Mexico. Canada (a high-income economy) and Mexico (an upper-middle-income economy) are partners of the United States in the North American Free Trade Agreement (NAFTA), whose trade-liberalizing provisions were gradually applied to intraregional agricultural trade during the 1994-2007 period. With respect to other parts of the world, the import shares from fast-growing exporters in South America and the former Soviet Union declined, even as those regions increased their participation in the global agricultural market. There were modest increases in import shares from developing East Asia and South Asia, which is consistent with their growing roles in global trade. This chart appears in the ERS report The Global Landscape of Agricultural Trade, 1995-2014, released in November 2017.