
The regional composition of U.S. exports has shifted toward developing East Asia over time
- by Jayson Beckman and Kari E.R. Heerman
- 1/16/2018
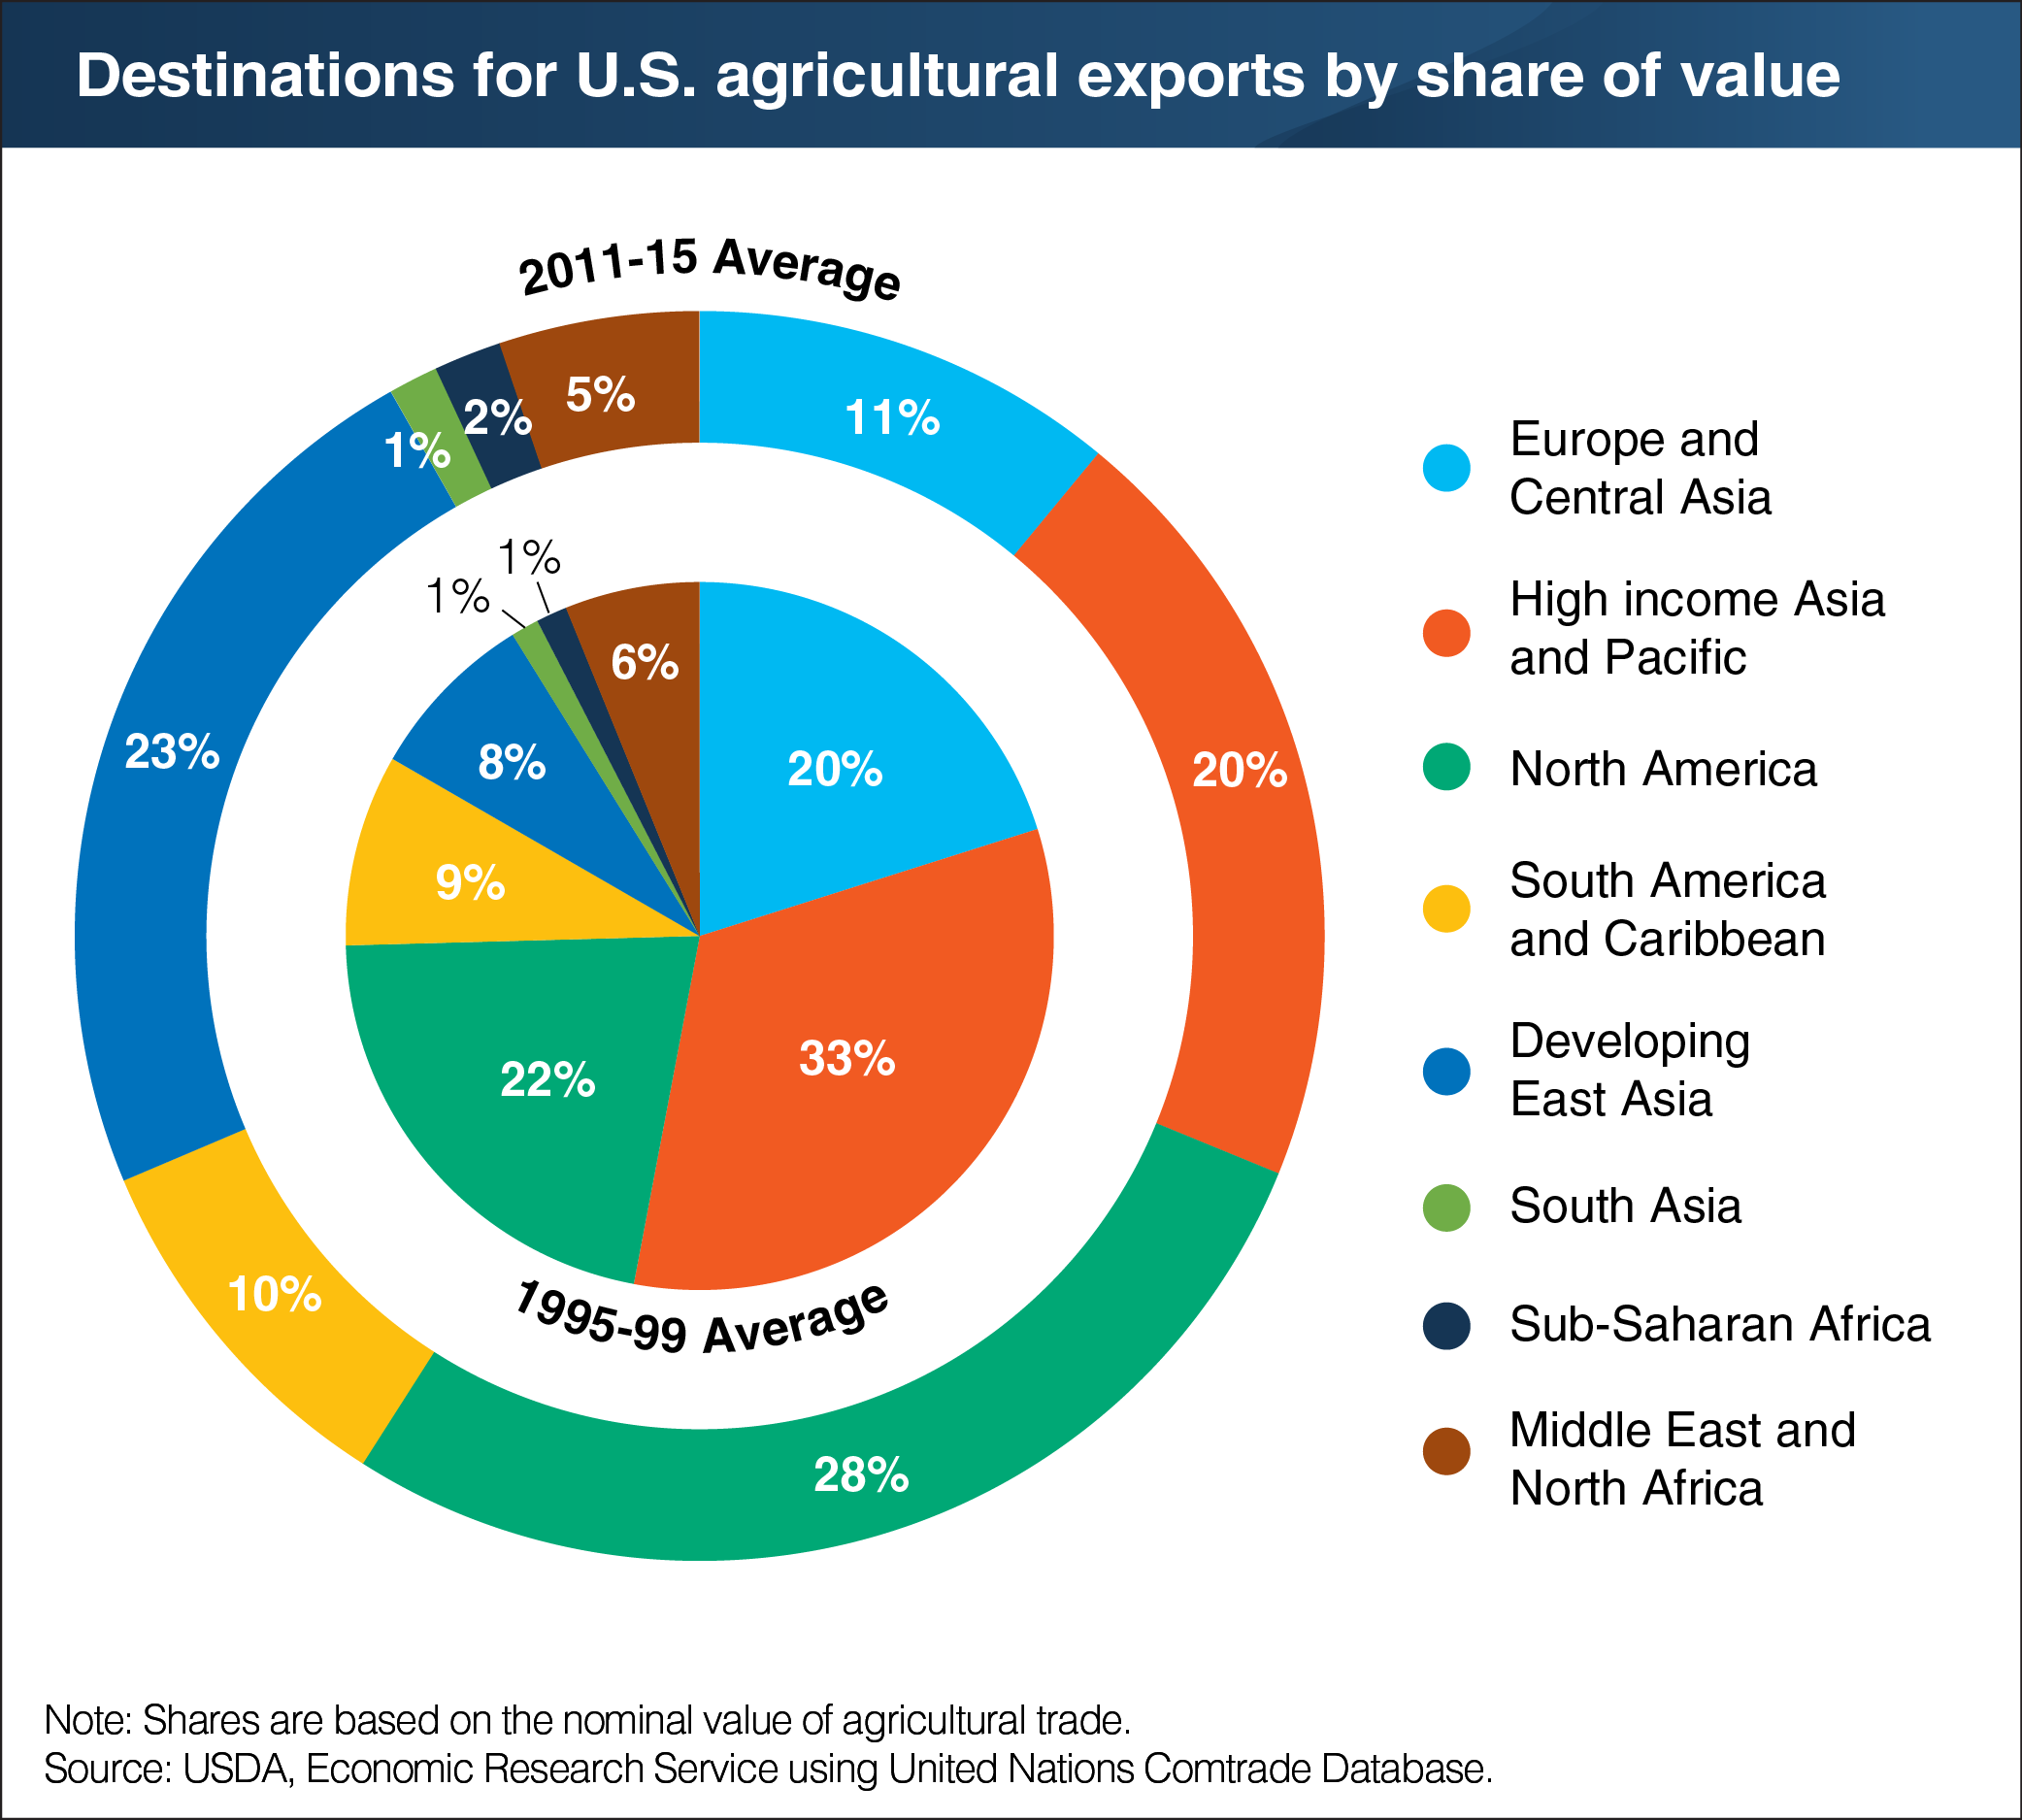
A marked shift in the destinations for U.S. agricultural exports has accompanied the increased participation of developing economies in global agricultural trade. Elimination of agricultural trade barriers within North America boosted exports to Canada and Mexico—partners with the United States in the North American Free Trade Agreement. Rising household incomes and changing trade policies in developing East Asia (China and Southeast Asia, less Singapore) led to a near tripling in that region’s share of U.S. agricultural exports. China’s share of U.S. agricultural exports swelled from 3 percent on average during 1995-99 to 16 percent during 2011-15. A single product—soybeans—accounts for half of this increase. However, the strong growth in demand for U.S. agricultural exports in East Asia and North America has been offset by a sharp decline in the share going to Europe and high-income economies in East Asia, particularly Japan. In the European Union, a number of barriers—including concerns over genetically modified products—continue to hamper U.S. agricultural trade. This chart appears in the ERS report The Global Landscape of Agricultural Trade, 1995-2014, released in November 2017.