
U.S. per capita use of fresh pumpkins, 2012-17
- by Gregory Astill
- 10/2/2018
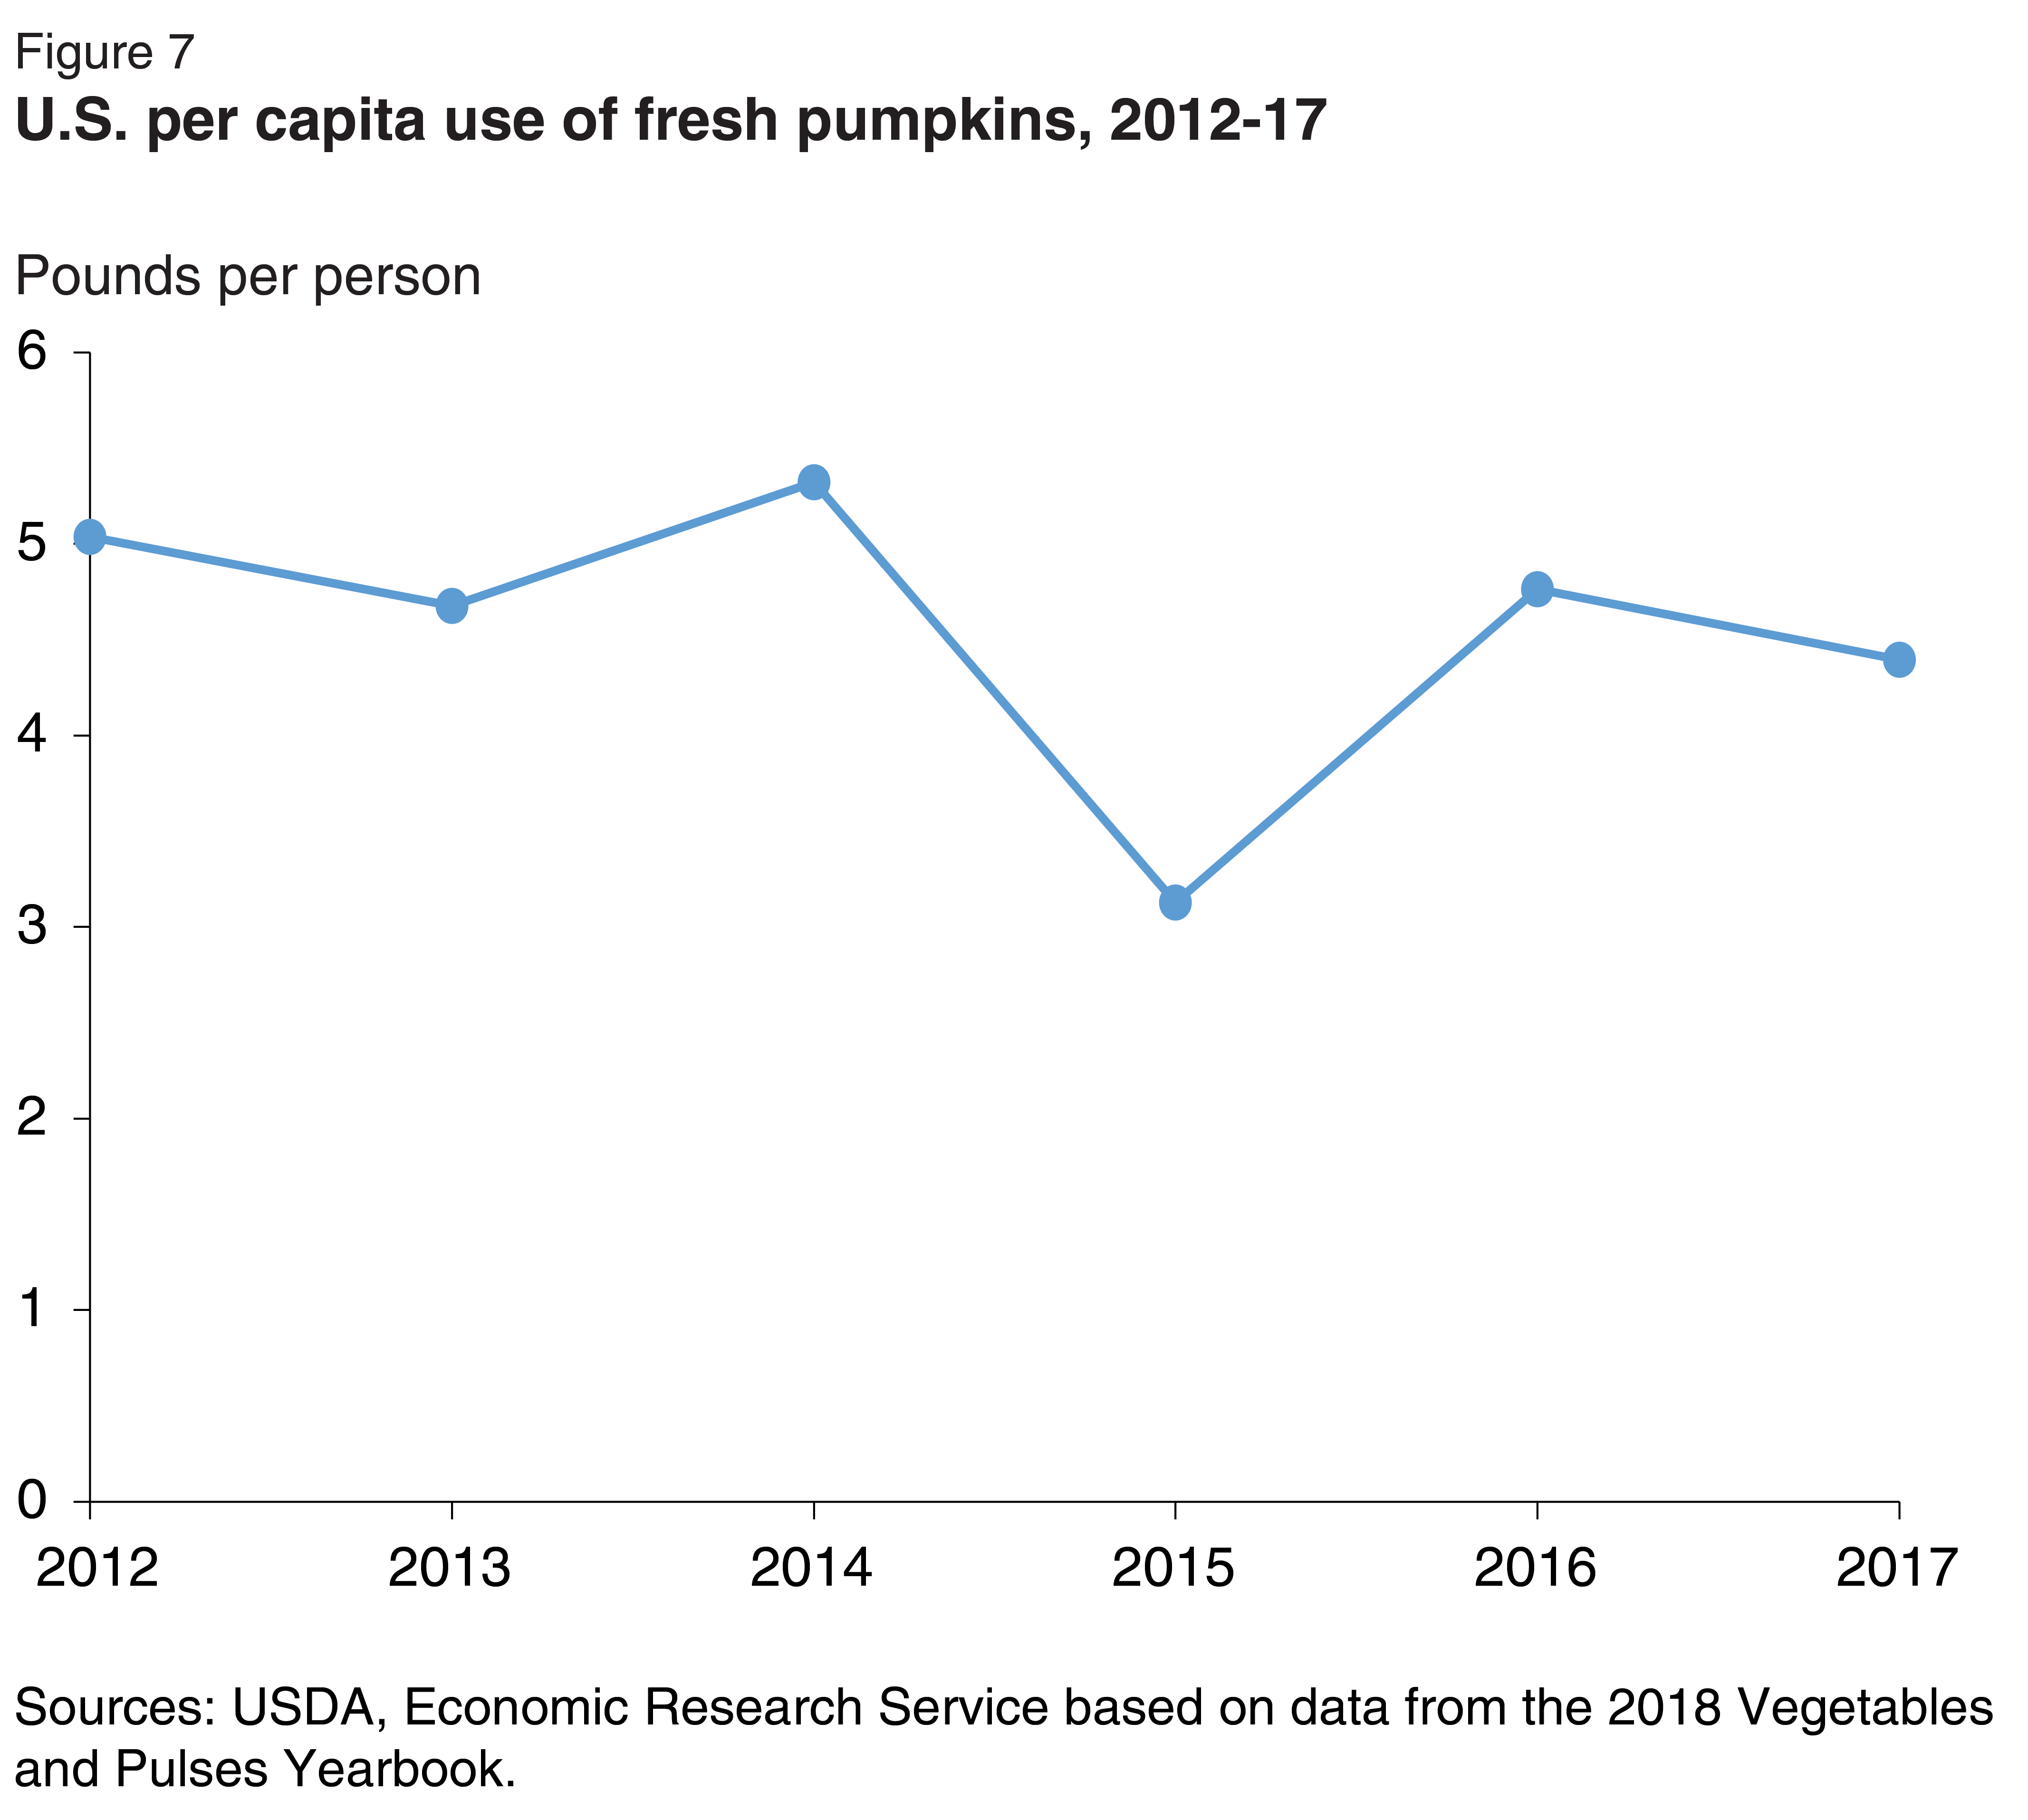
Line graph of pounds per capita pumpkin use for the United States for the years 2012 to 2017.
Official websites use .gov
A .gov website belongs to an official government organization in the United States.
Secure .gov websites use HTTPS
A lock (
) or https:// means you’ve safely connected to the .gov website. Share sensitive information only on official, secure websites.
Line graph of pounds per capita pumpkin use for the United States for the years 2012 to 2017.