
Pumpkin production value, nine States, 2012-17
- by Gregory Astill
- 10/2/2018
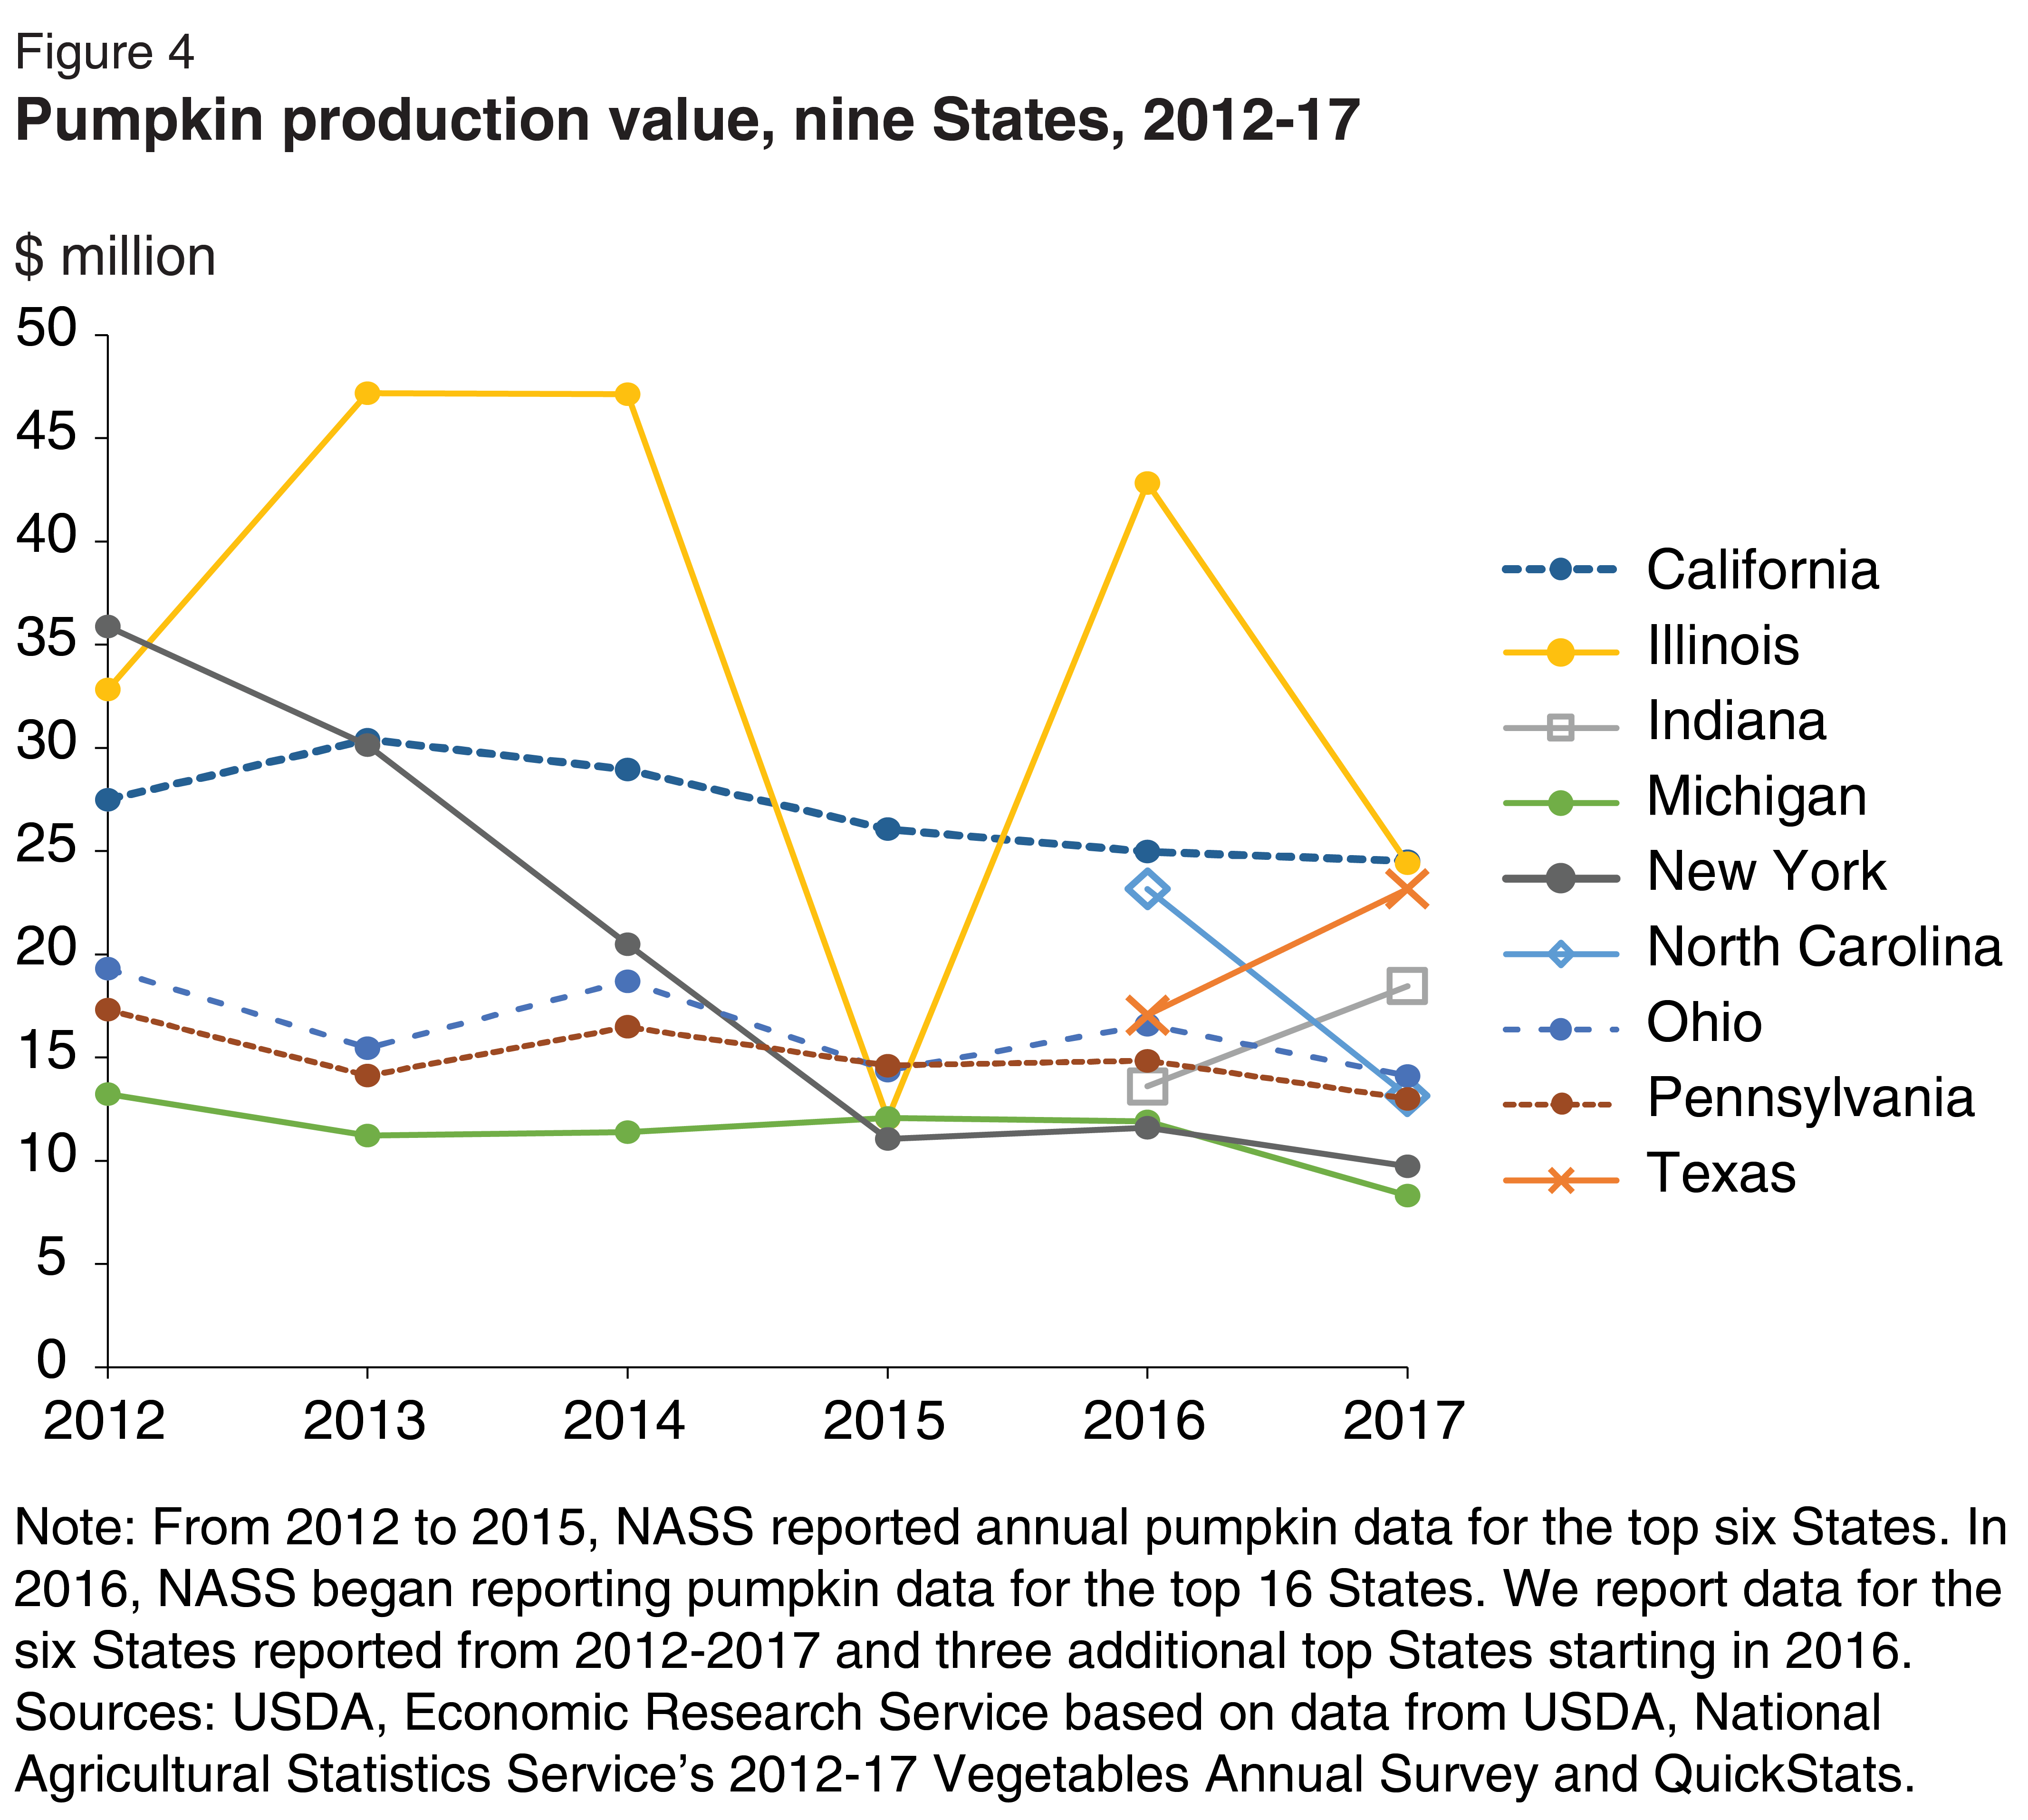
Line graph of millions of dollars of pumpkins sold for California, Illinois, Indiana, Michigan, New York, North Carolina, Ohio, Pennsylvania, and Texas for the years 2012 to 2017.