
Almost three-fourths of the average dollar Americans spend eating out covers restaurant services
- by Sarah Rehkamp
- 8/14/2017
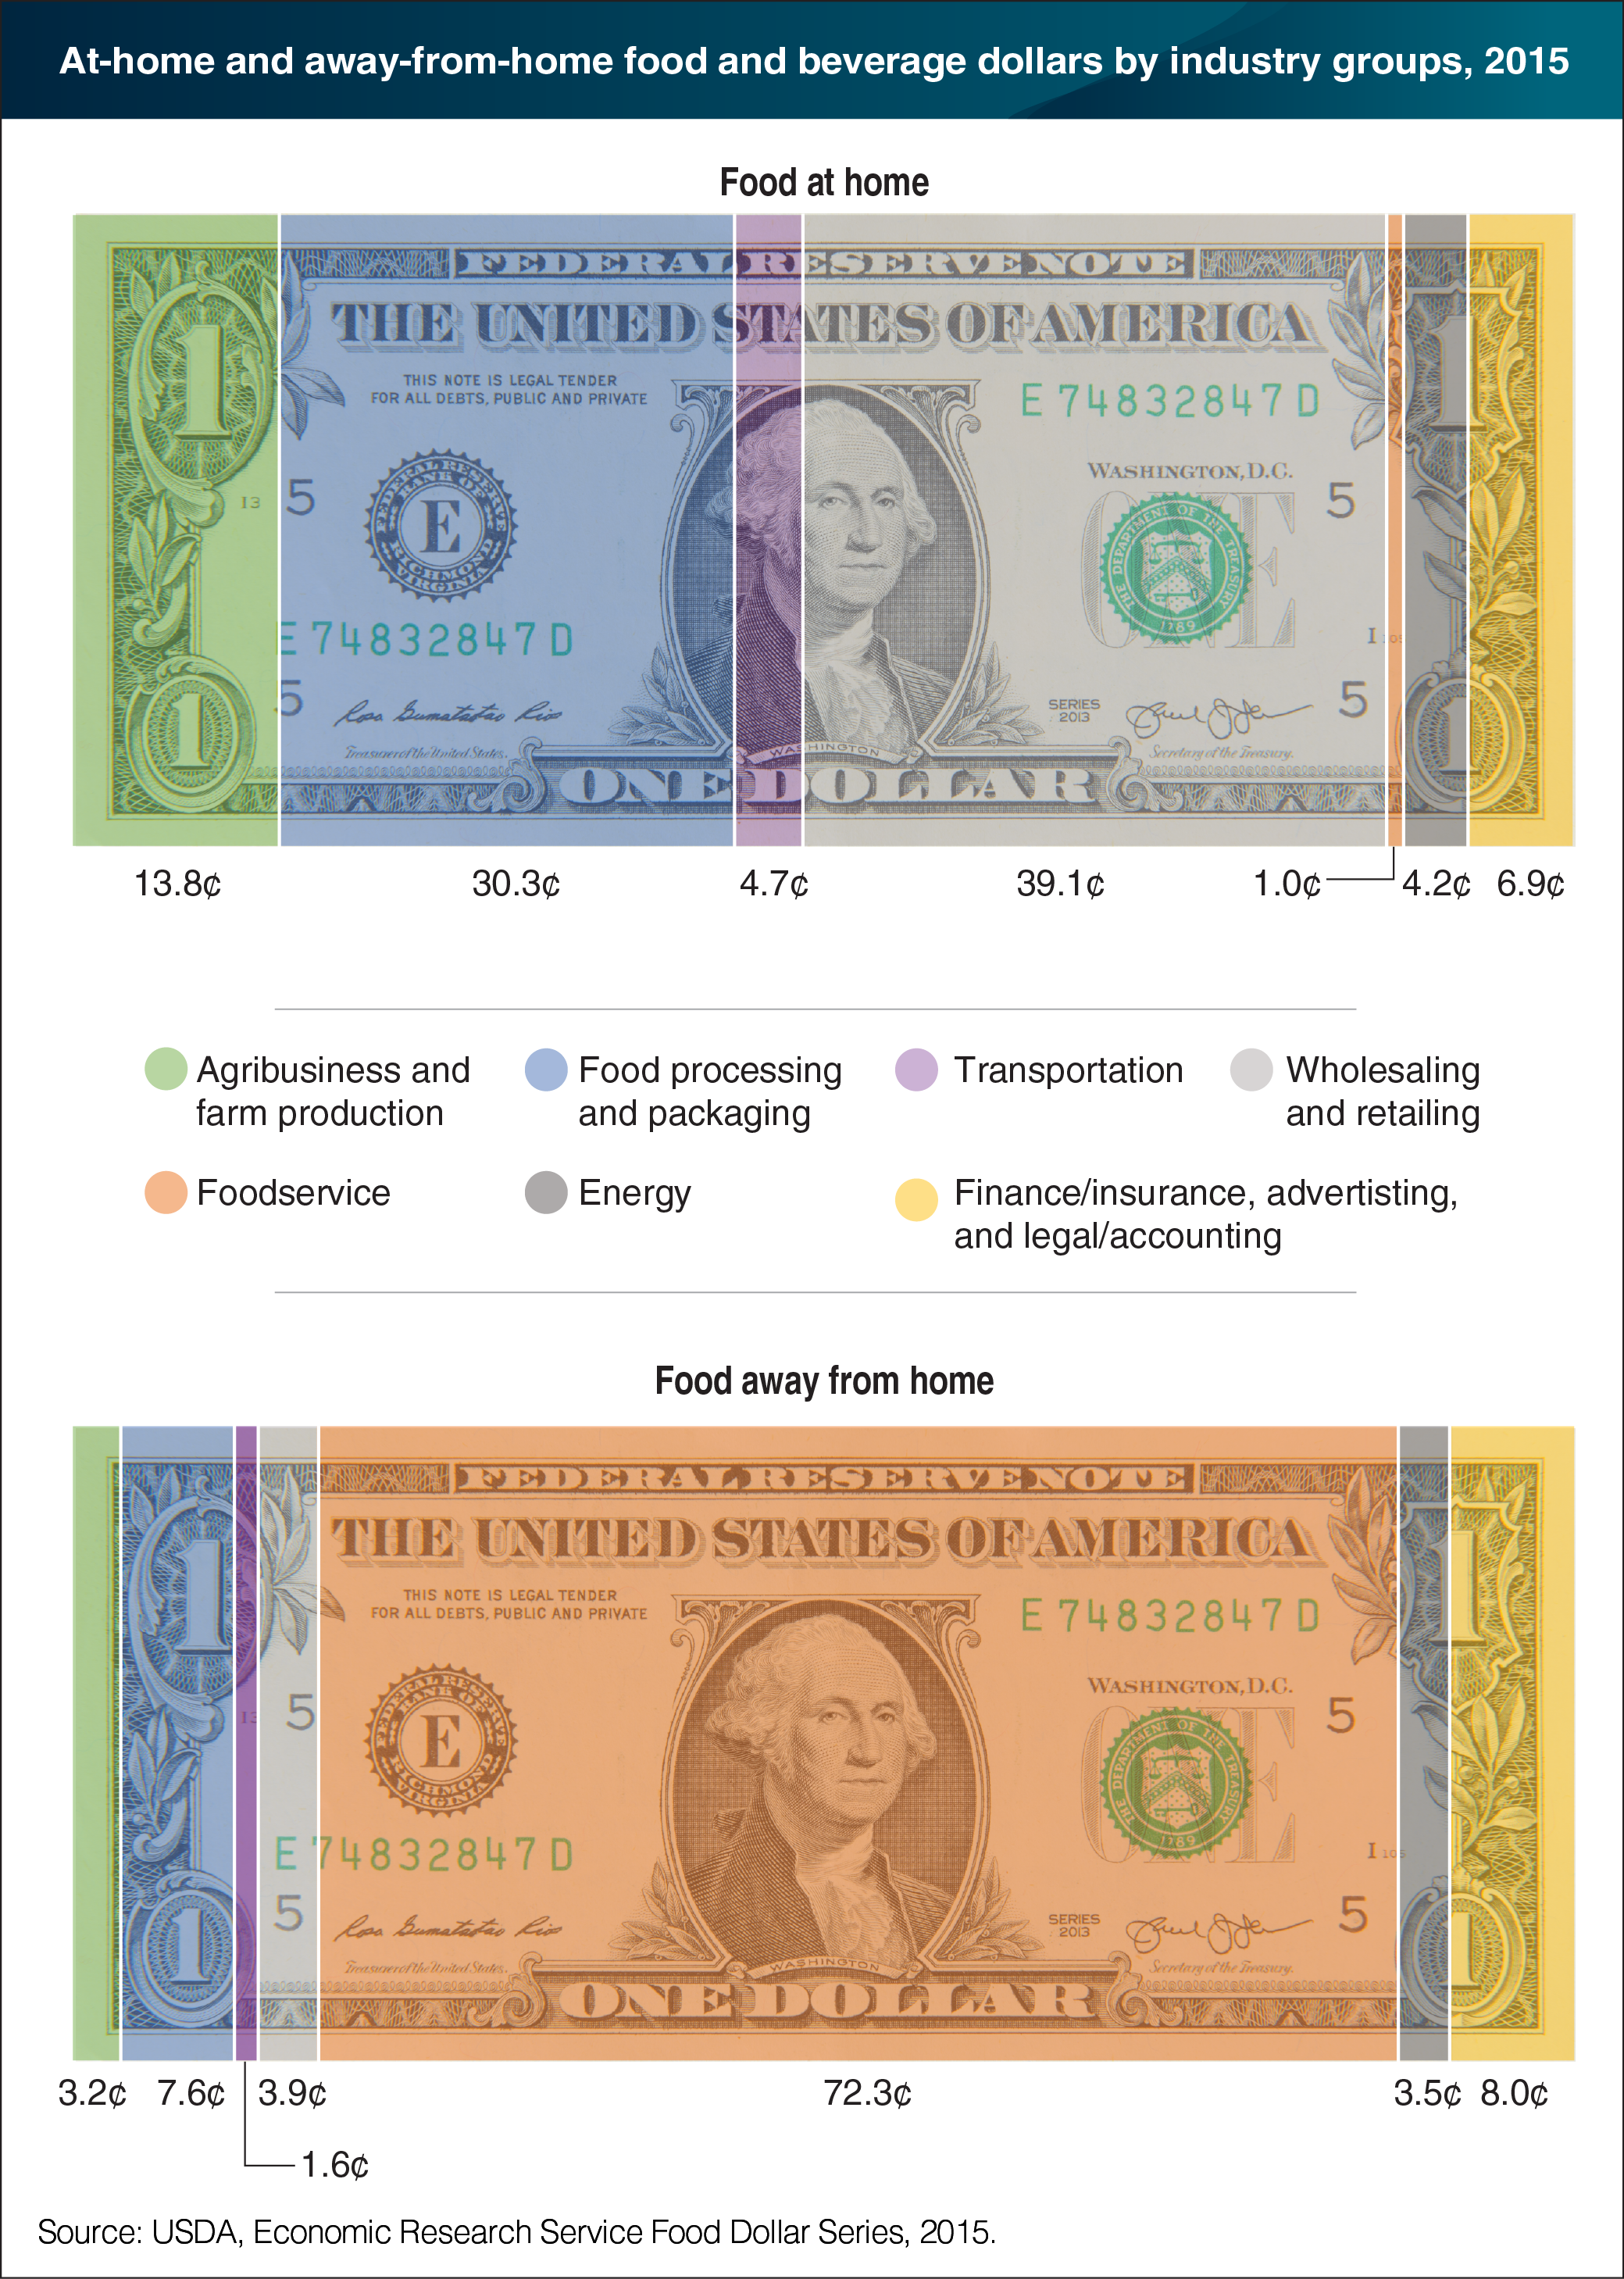
Rising prices for farm commodities generally have a larger impact on grocery store price tags than on restaurant menus. The reason? Different cost structures, as shown by ERS’s Food Dollar Series. This series apportions total annual expenditures by U.S. consumers on domestically-produced food and beverages to 12 industry groups based on the value added by each industry. In 2015, farm production and agribusiness industries accounted for 13.8 cents of the food-at-home dollar (foods and beverages purchased from grocery stores and other retailers) and 3.2 cents of the food-away-from-home dollar (foods and beverages from fine dining establishments, fast casual chains, and coffee shops). Thus, grocery store prices are more closely connected to farm prices than restaurant prices. The largest share of the away-from-home food dollar—72.3 cents in 2015—was spent on the services provided by restaurants, including the labor of baristas, bakers, and busboys. Sixty-two percent of this value added by foodservice establishments (44.7 cents) covered the salaries and benefits of employees involved in preparing and serving meals and cleaning up afterwards. This chart appears in "Since 2009, Restaurant Prices Have Generally Risen Faster Than Grocery Store Prices" in ERS’s Amber Waves magazine, August 2017.