
Nominal and inflation-adjusted U.S. farm production expenses, 1970–2025F
- by Farm Income Team
- 9/3/2025
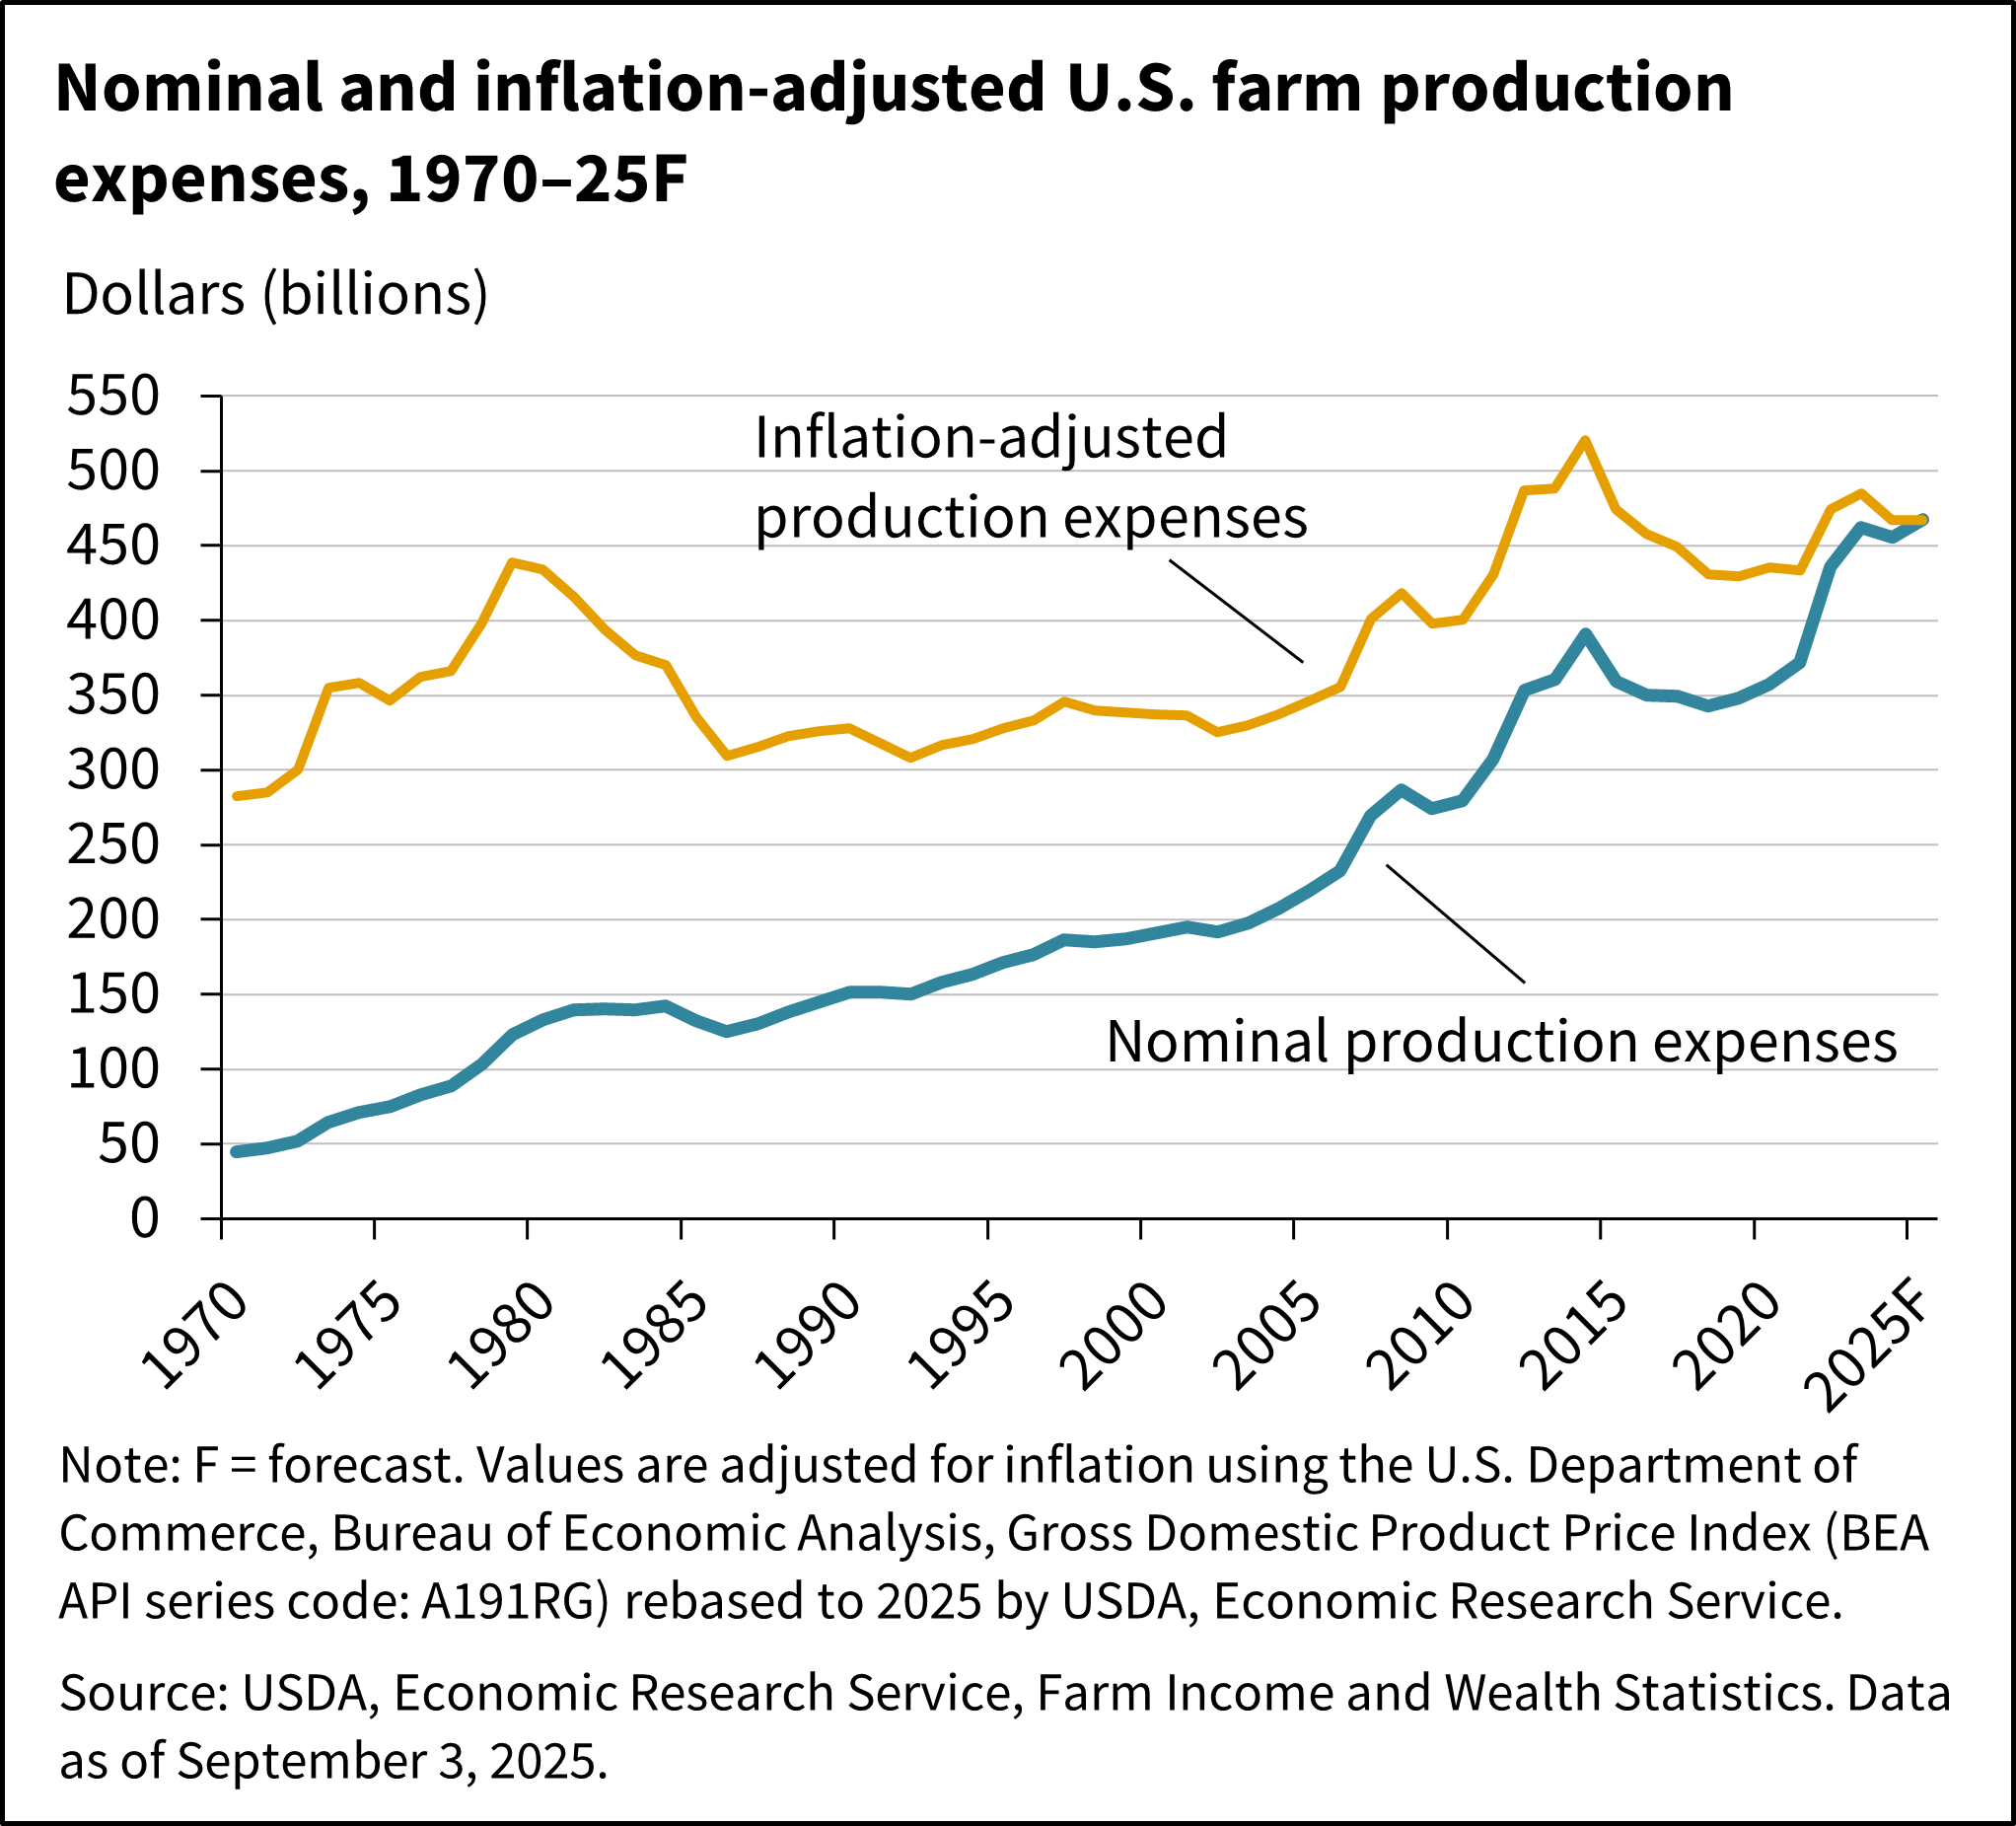
Farm sector production expenses are forecast at $467.4 billion in 2025, increasing by $12.0 billion (2.6 percent), compared with 2024.