
U.S. net farm income and net cash farm income, inflation adjusted, 2005–25F
- by Farm Income Team
- 9/3/2025
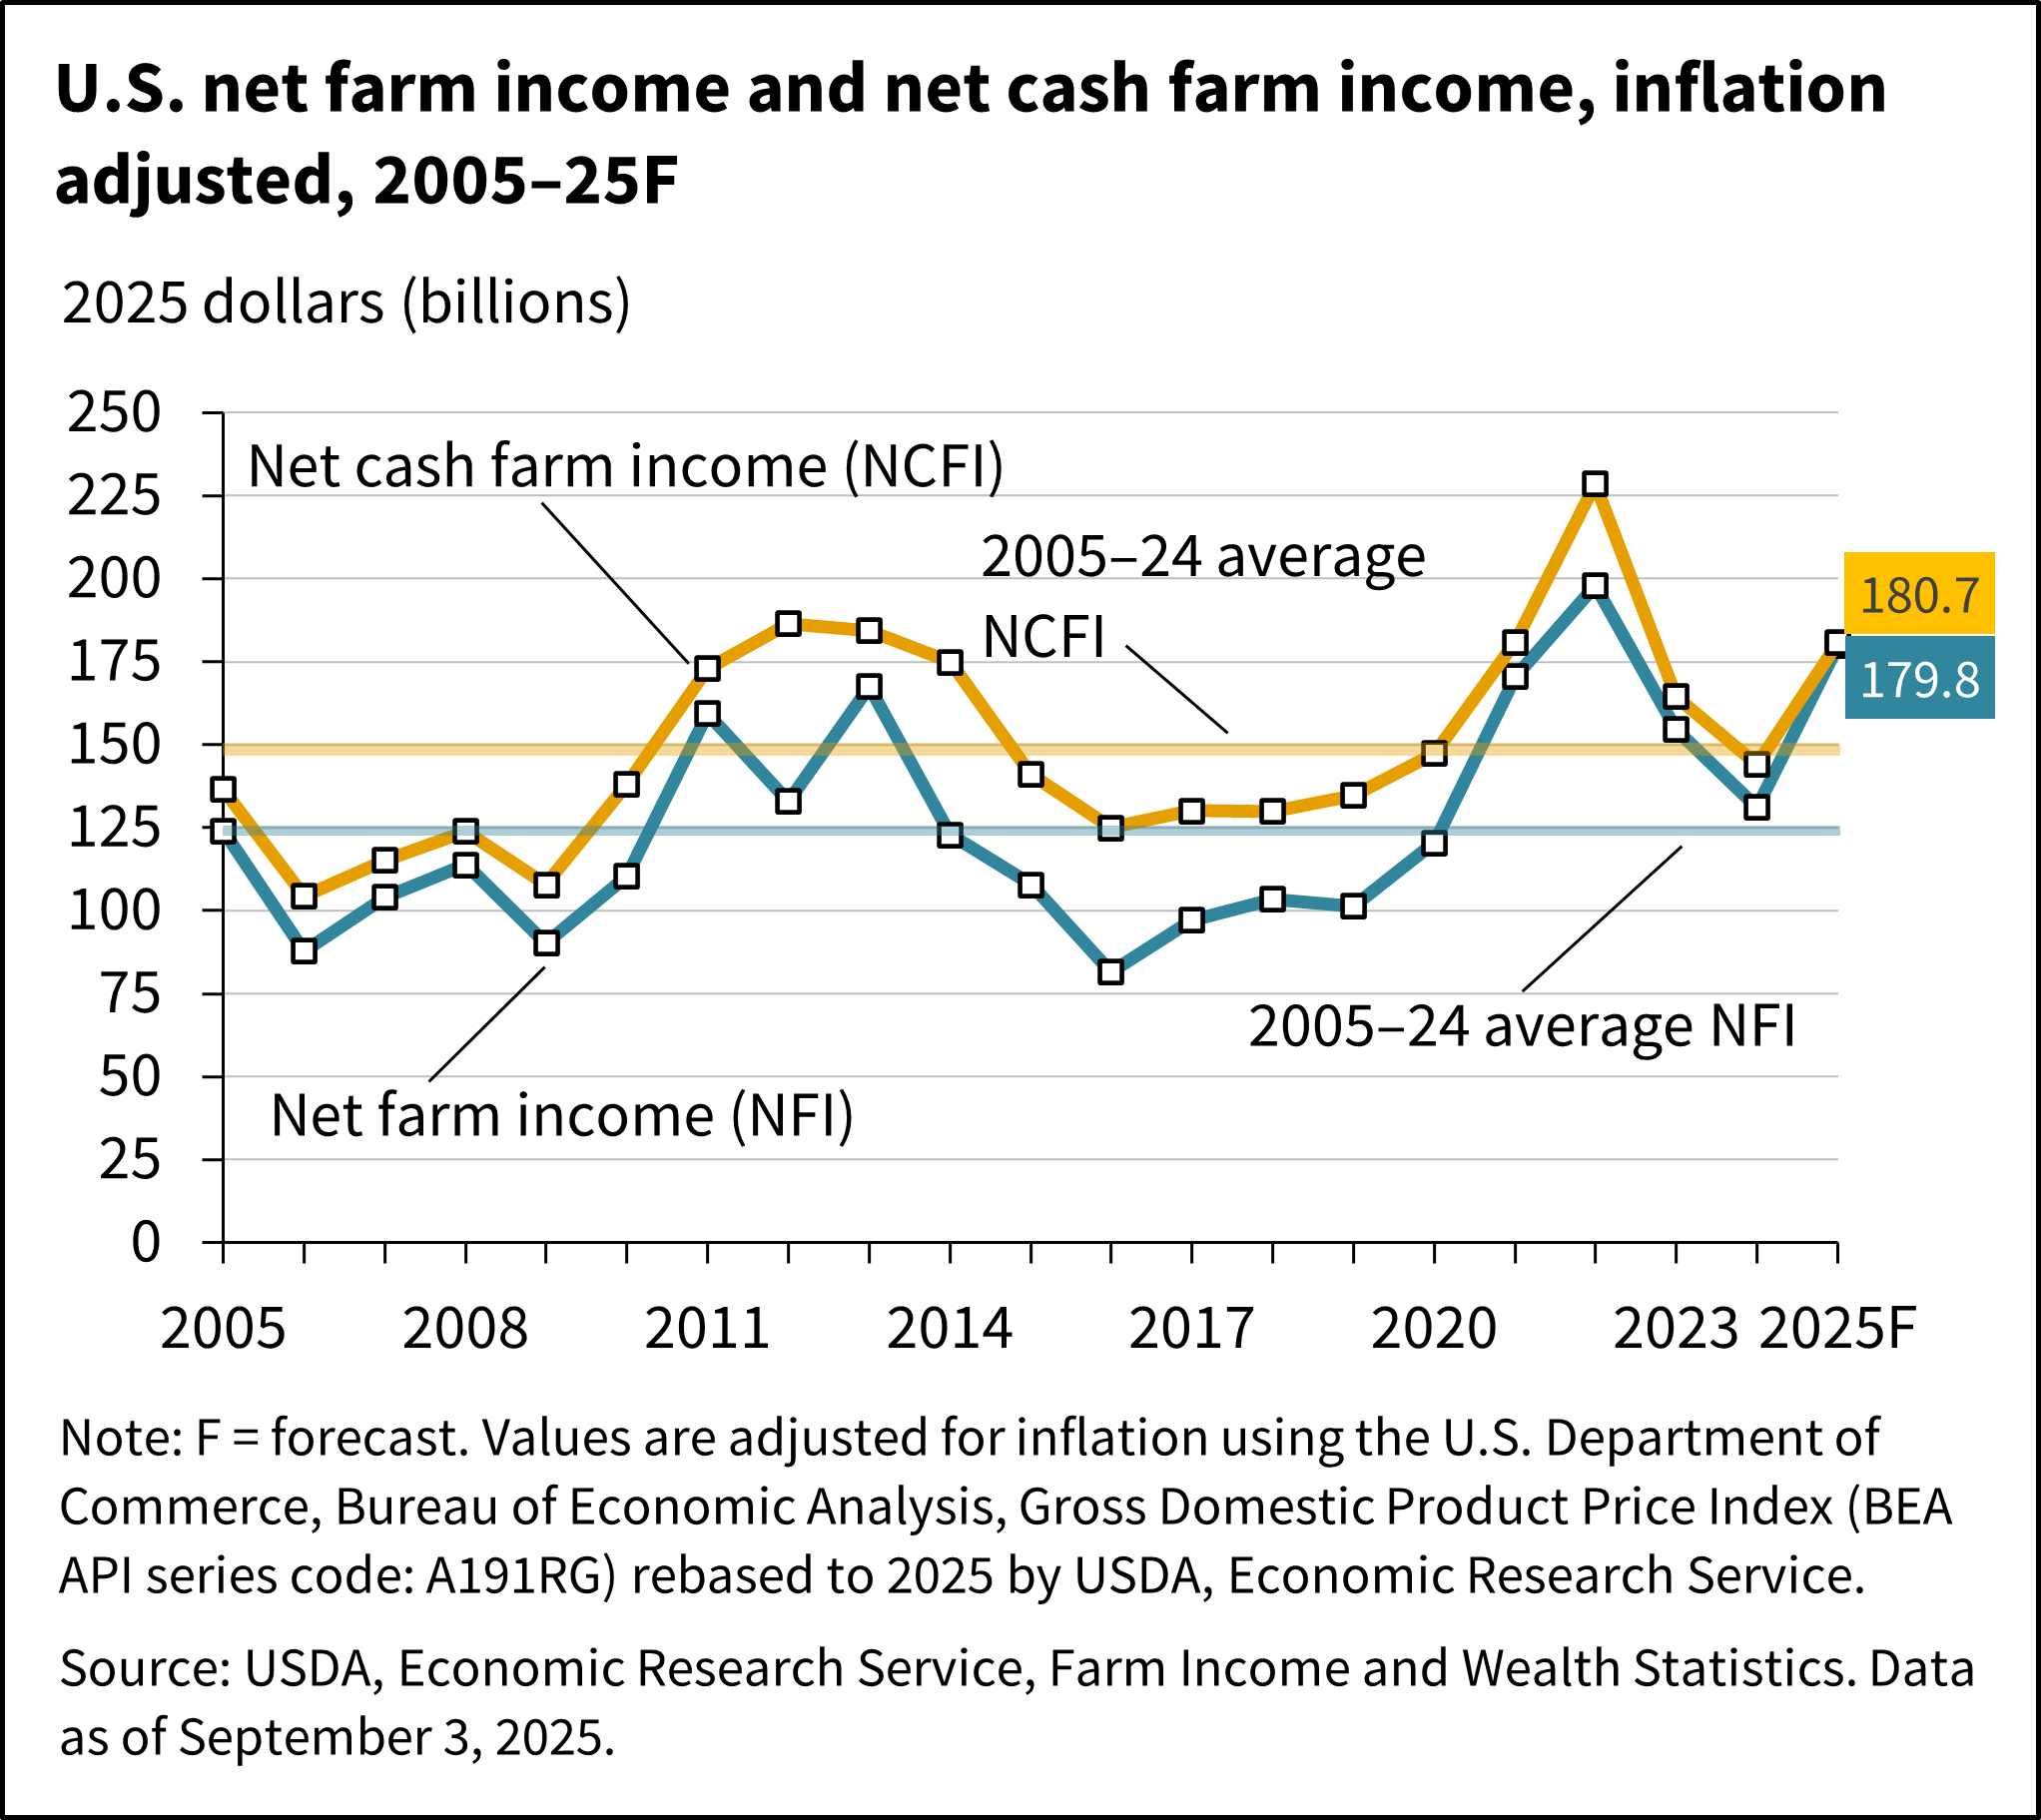
Net farm income, a broad measure of profits, is forecast at $179.8 billion for calendar year 2025, an increase of $52.0 billion (40.7 percent) relative to 2024 in nominal (not adjusted for inflation) dollars. After adjusting for inflation, net farm income is forecast to increase by $48.8 billion (37.2 percent) in 2025 relative to 2024. With this expected increase, 2025 net farm income would remain above its 20-year average (2005–24) in inflation-adjusted dollars.