
U.S. orange juice production continues to decline
- by Agnes Perez
- 8/9/2016
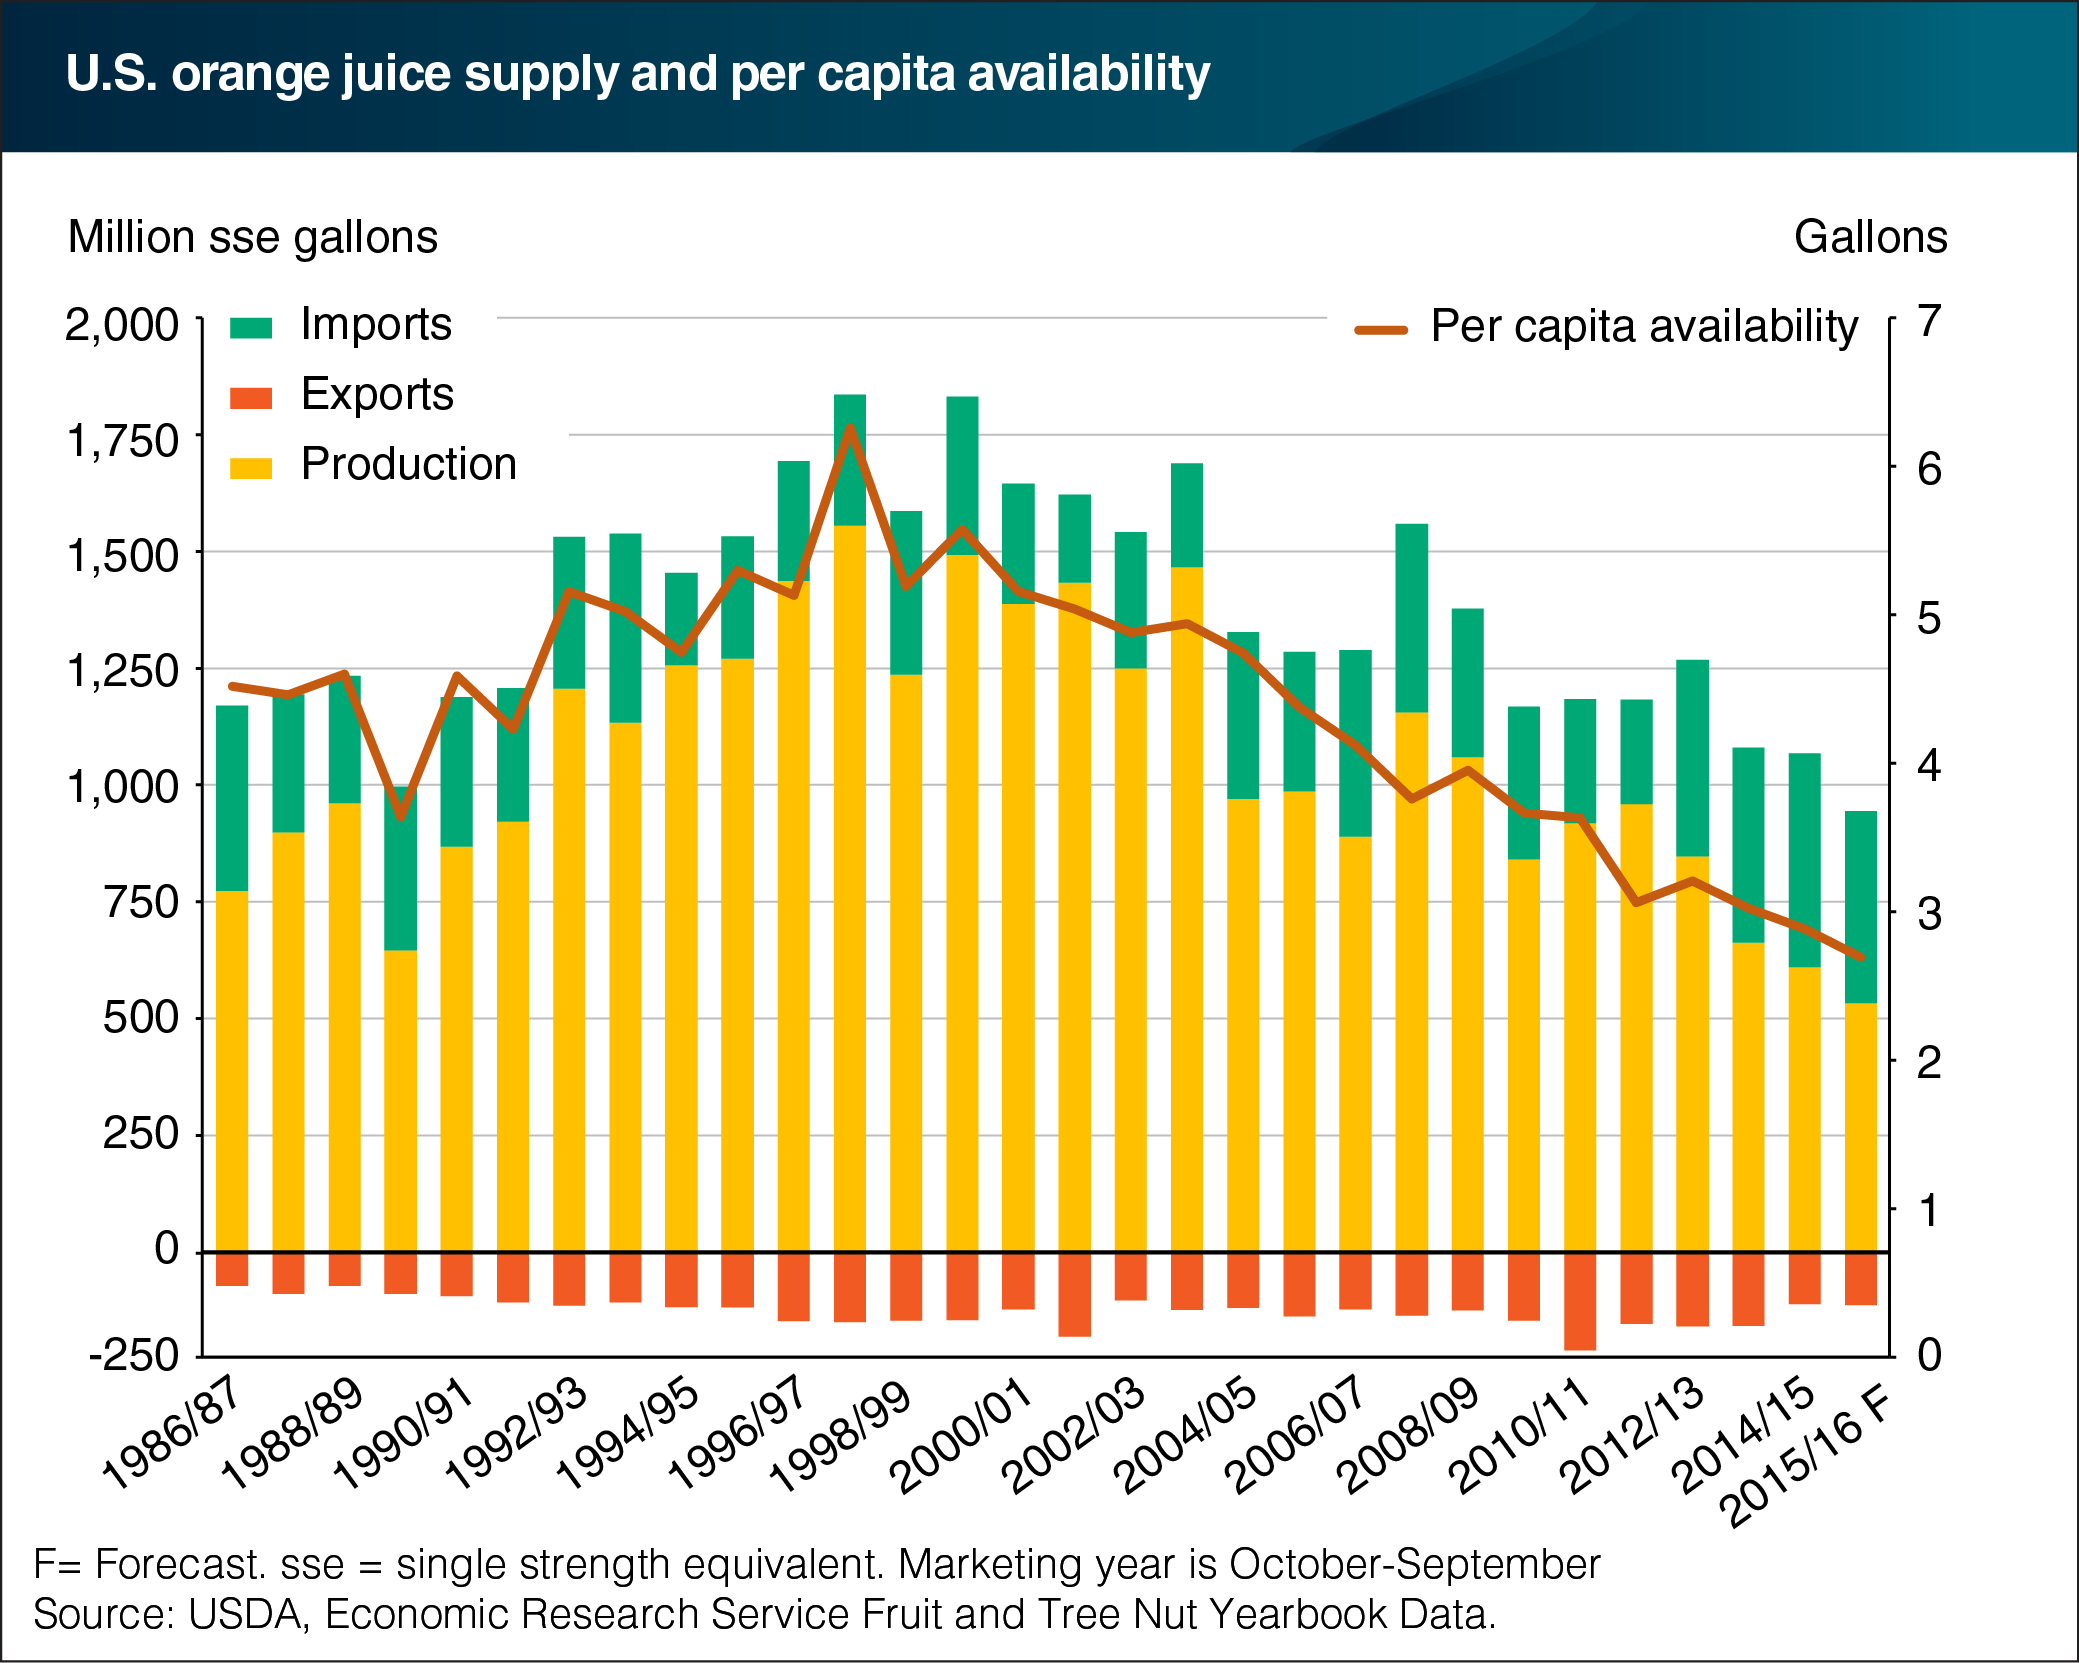
U.S. orange juice production peaked during the 1997/98 season at 1,555 million gallons (single-strength equivalent; sse), but has trended lower since then to only 533 million sse gallons expected for the 2015/16 season. The production decline reflects many factors, including the increased prevalence of diseases such as citrus canker and citrus greening, as well as pressures from urbanization in parts of Florida that have reduced the area devoted to citrus production. The United States has been a net importer of orange juice for the entire period of analysis (1986/87 to 2015/16). Exports of orange juice have remained fairly constant over time, whereas imports have increased in recent years, but not by enough to compensate for the decline in U.S. production. As a result, orange juice availability per capita (a proxy for consumption) has trended lower as well, falling from a peak of 6.27 gallons in the 1997/98 season to a forecast low of 2.74 gallons in 2015/16. The decline in orange juice consumption over the past decade is consistent with trends that have also been observed for other types of fruit juice and caloric soft drinks in the United States. This chart is based on data found in ERS’s June 2016 Fruit and Tree Nuts Outlook report.