
U.S. rice ending stocks could rise to the highest level in three decades
- by Nathan Childs
- 7/1/2016
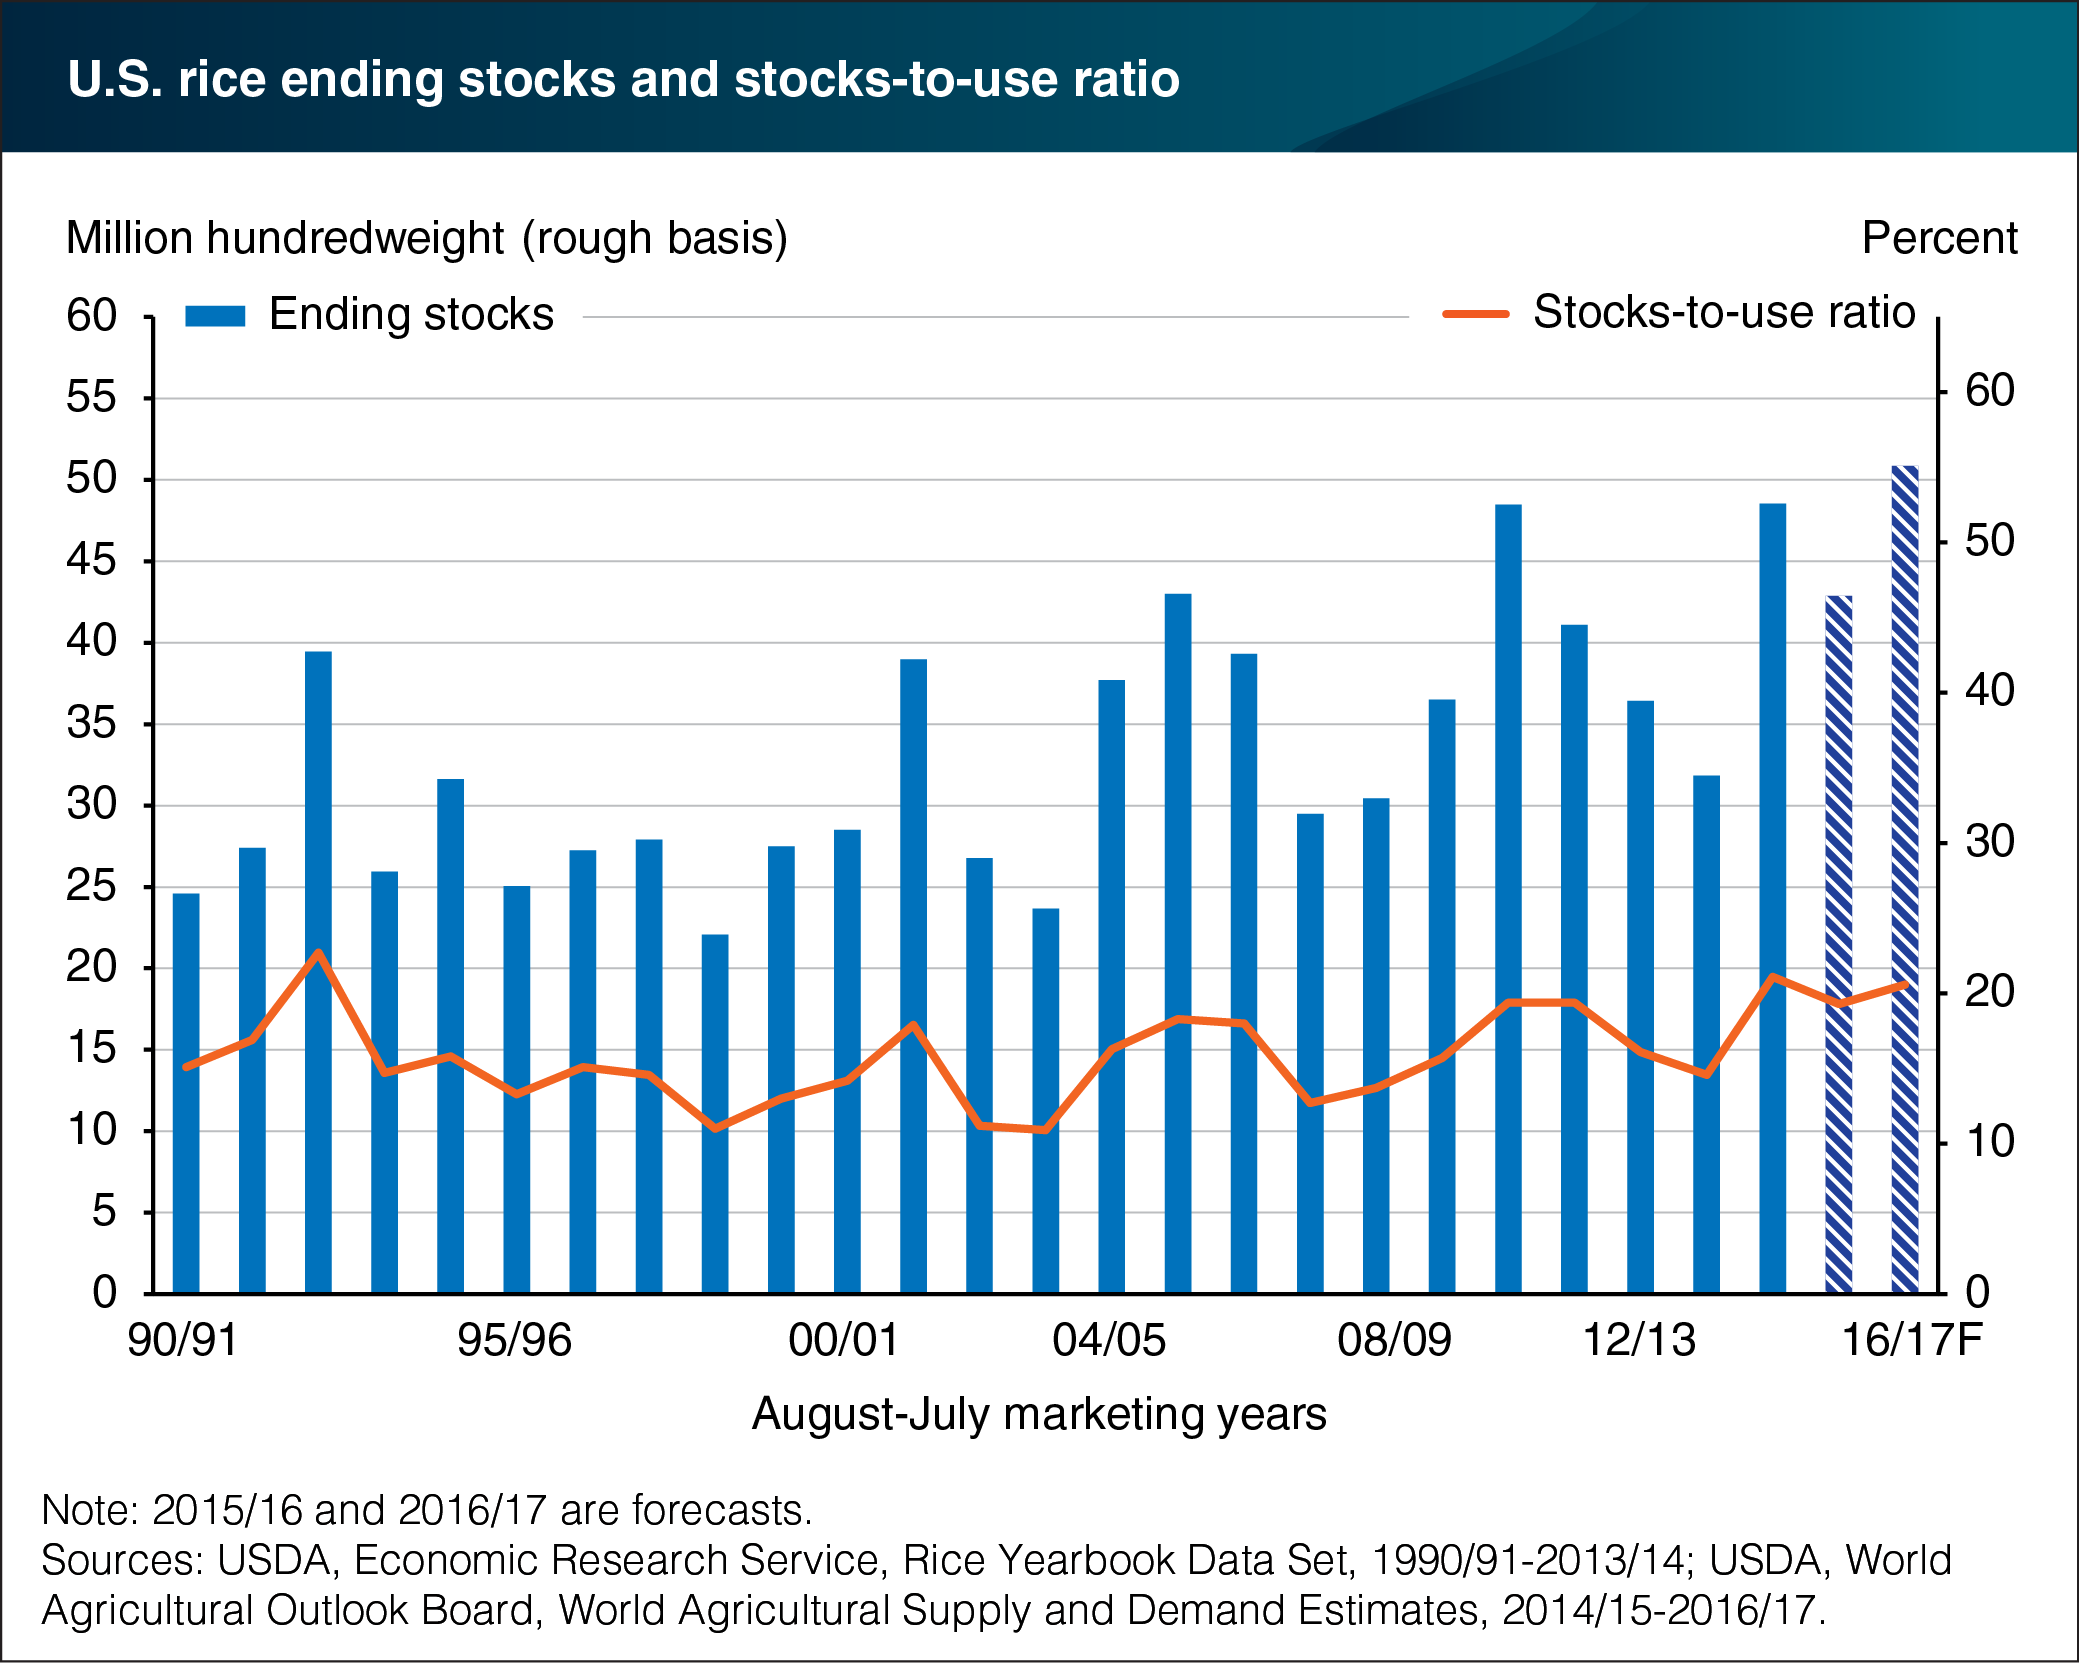
U.S. ending stocks of rice for the 2016/17 (August-July) marketing year are projected at 50.9 million hundredweight (cwt), up 19 percent from a year earlier and the highest since 1986/87. The substantial buildup in stocks is the result of a large increase in 2016/17 production that exceeds the gains expected in domestic use and exports. U.S. rice production for the 2016/17 marketing year is expected to reach 231.0 million cwt, the highest since 2010/11 and third largest on record. The bumper crop—up 20 percent from a year earlier—is primarily due to a large increase in harvested area as well as a slightly higher expected yield. At 3.06 million acres, 2016/17 plantings are up 17 percent from a year earlier and the highest since 2010/11. The substantial area increase is largely due to a return of several hundred thousand acres in the South that were not planted last year due to adverse weather, a lack of economically viable alternatives at planting time in the southern States, and an end to water restrictions in the Texas Rice Belt. The rising level of rice stocks in the United States is in contrast to the tightening stock levels currently faced by several of the world’s largest exporters—primarily India, Thailand, and Pakistan. Global ending stocks, excluding China, are expected to be down 13 percent from a year earlier, the fourth consecutive year of decline and the lowest since 2004/05. This chart is from the Rice Outlook June 2016 report.