
Number of farms with direct-to-consumer sales increases, sales plateau
- by Stephen Vogel
- 5/6/2016
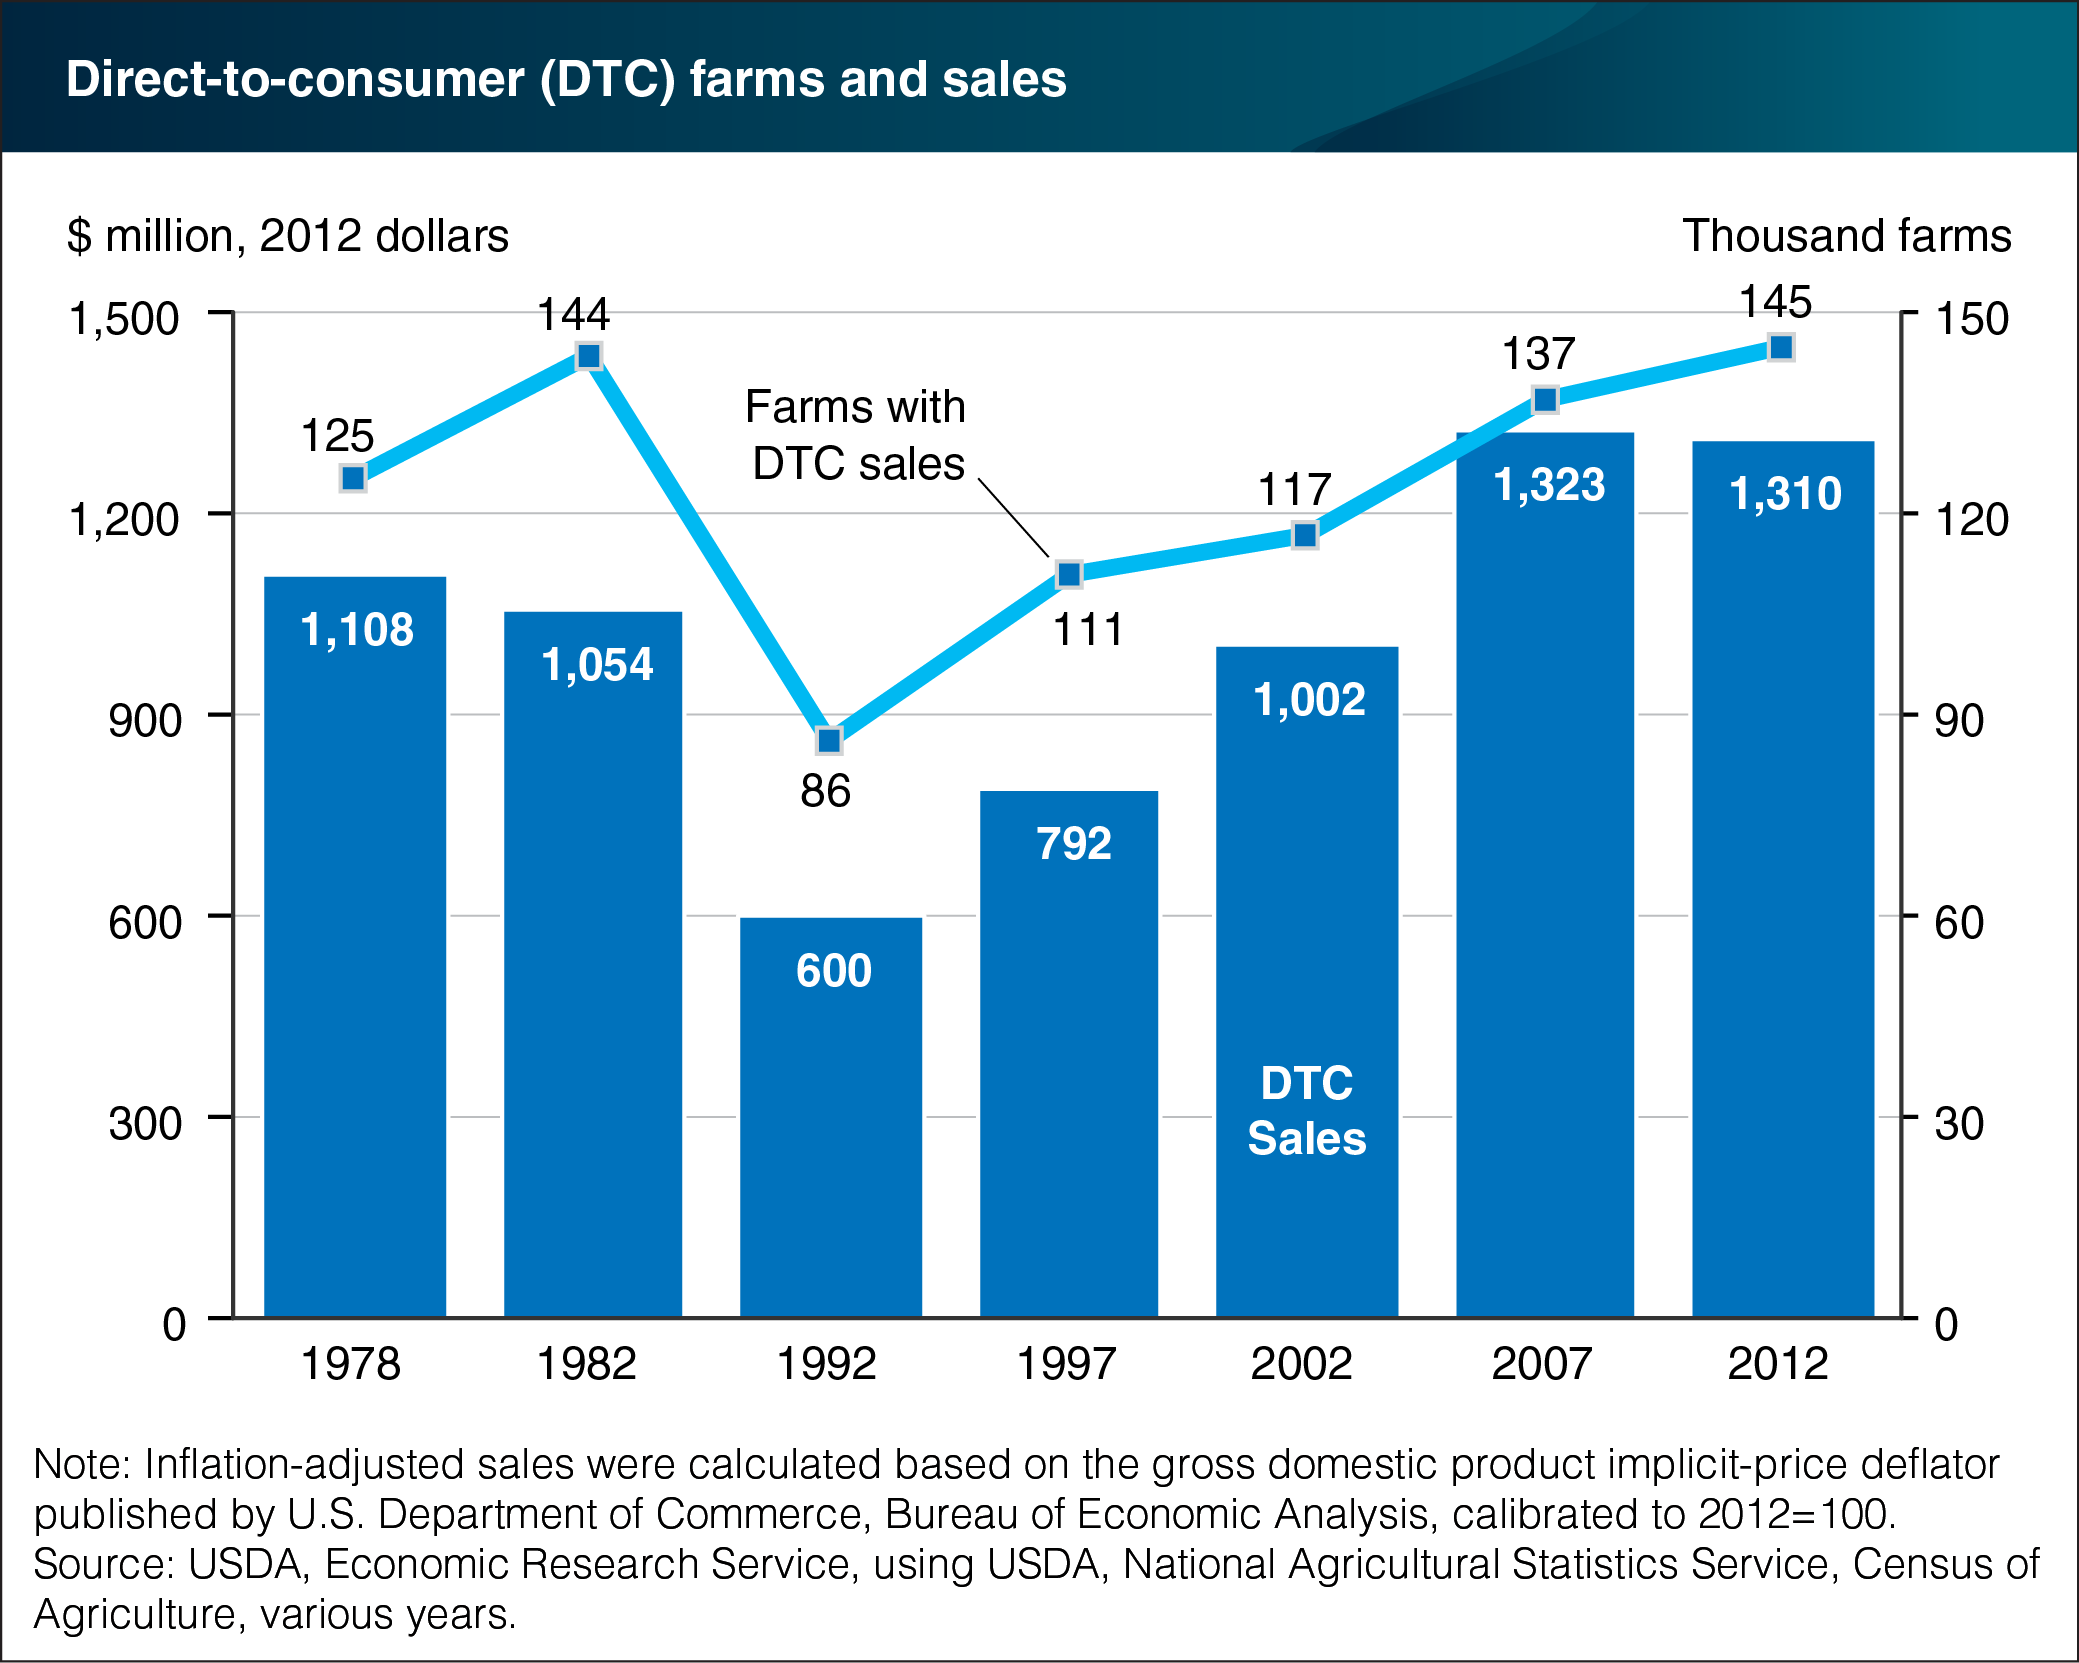
Data on direct-to-consumer (DTC) food sales were first collected in the 1978 Census of Agriculture, and DTC sales data have been collected in every agricultural census thereafter (except in 1987). In 1992, the number of DTC farms fell to the lowest level since information collection on DTC farms began; since that time, the number has slowly and steadily increased, peaking in 2012. The constant-dollar value of DTC sales increased as well, before declining slightly in 2012. Two factors may have contributed to the lack of growth in DTC sales over 2007-12. First, consumer demand for local food purchased through DTC outlets may have plateaued. Second, where local food systems have been thriving, farmers may have been able to direct more of their sales to “intermediated” outlets, such as local restaurants and retailers, institutions, and local aggregators. ERS research finds that the number of farms marketing through intermediated channels increased by 34 percent from 36,000 in 2008 to 48,300 in 2012 (not shown in graph). This chart updates one found in the ERS report, Direct and Intermediated Marketing of Local Foods in the United States, November 2011, and draws on information from Trends in U.S. Local and Regional Food Systems: A Report to Congress, January 2015.