
Canada, Mexico, and the EU supply more than half of U.S. agricultural imports
- by Economic Research Service
- 2/12/2016
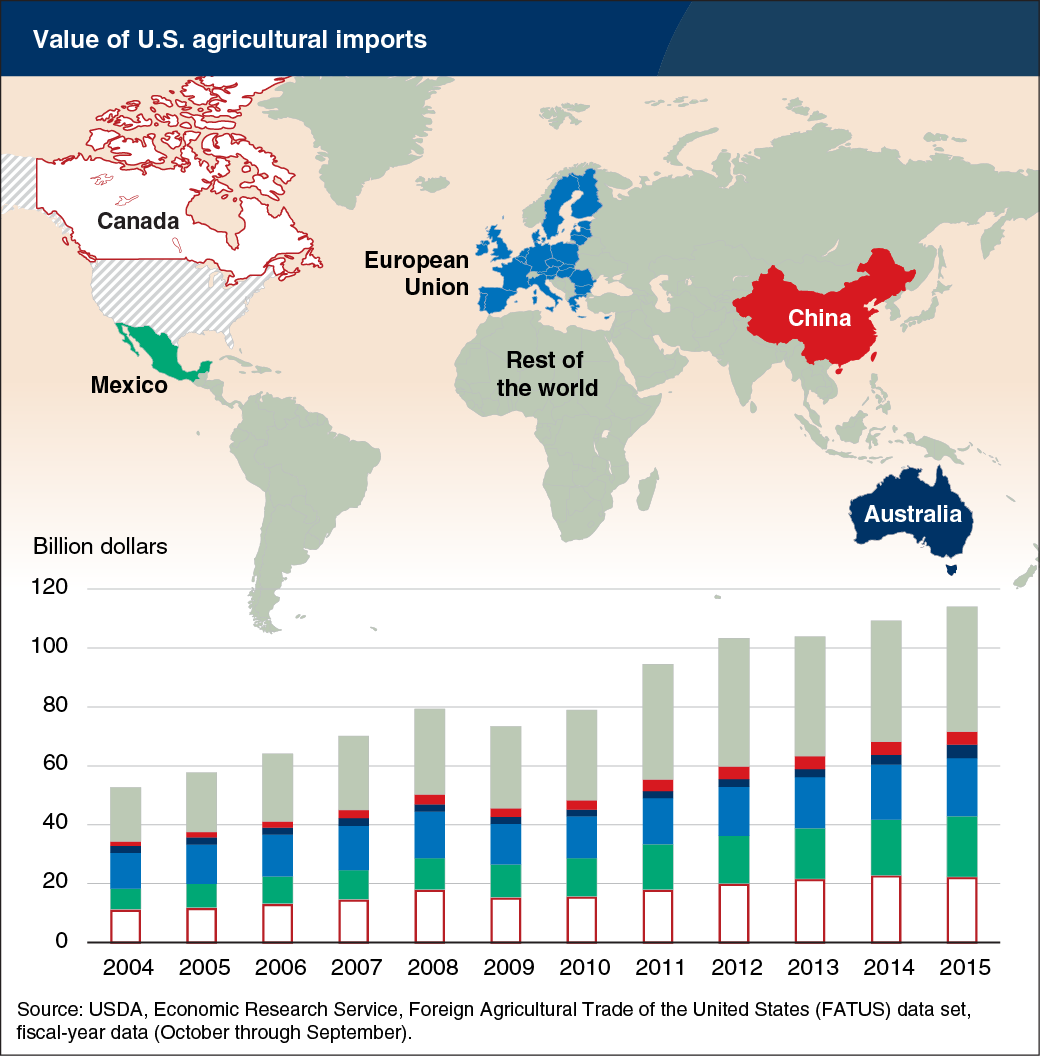
The value of U.S. agricultural imports has more than doubled since 2004, exceeding $114 billion in fiscal year 2015 and up 4 percent from the previous year. Canada and Mexico are the two largest sources of U.S. agricultural imports and account for about one-third of the total value, while the combined value of imports from the countries that comprise the European Union roughly equal the value of imports from Canada. Together, Canada, Mexico, and the European Union account for just over half of the value of agricultural products that the United States imports, and this share has held relatively constant over the past decade although the import shares for Canada and the EU have declined, while Mexico’s has grown. The $4.3 billion in agricultural imports from China in 2015 still accounts for less than 4 percent of the U.S. total, but has grown by nearly 170 percent since 2004. This data in this chart is from the ERS Foreign Agricultural Trade of the United States data set.
We’d welcome your feedback!
Would you be willing to answer a few quick questions about your experience?