
Volatile energy costs fall to 5.7 cents of the U.S. food-at-home dollar in 2013
- by Patrick Canning
- 12/7/2015
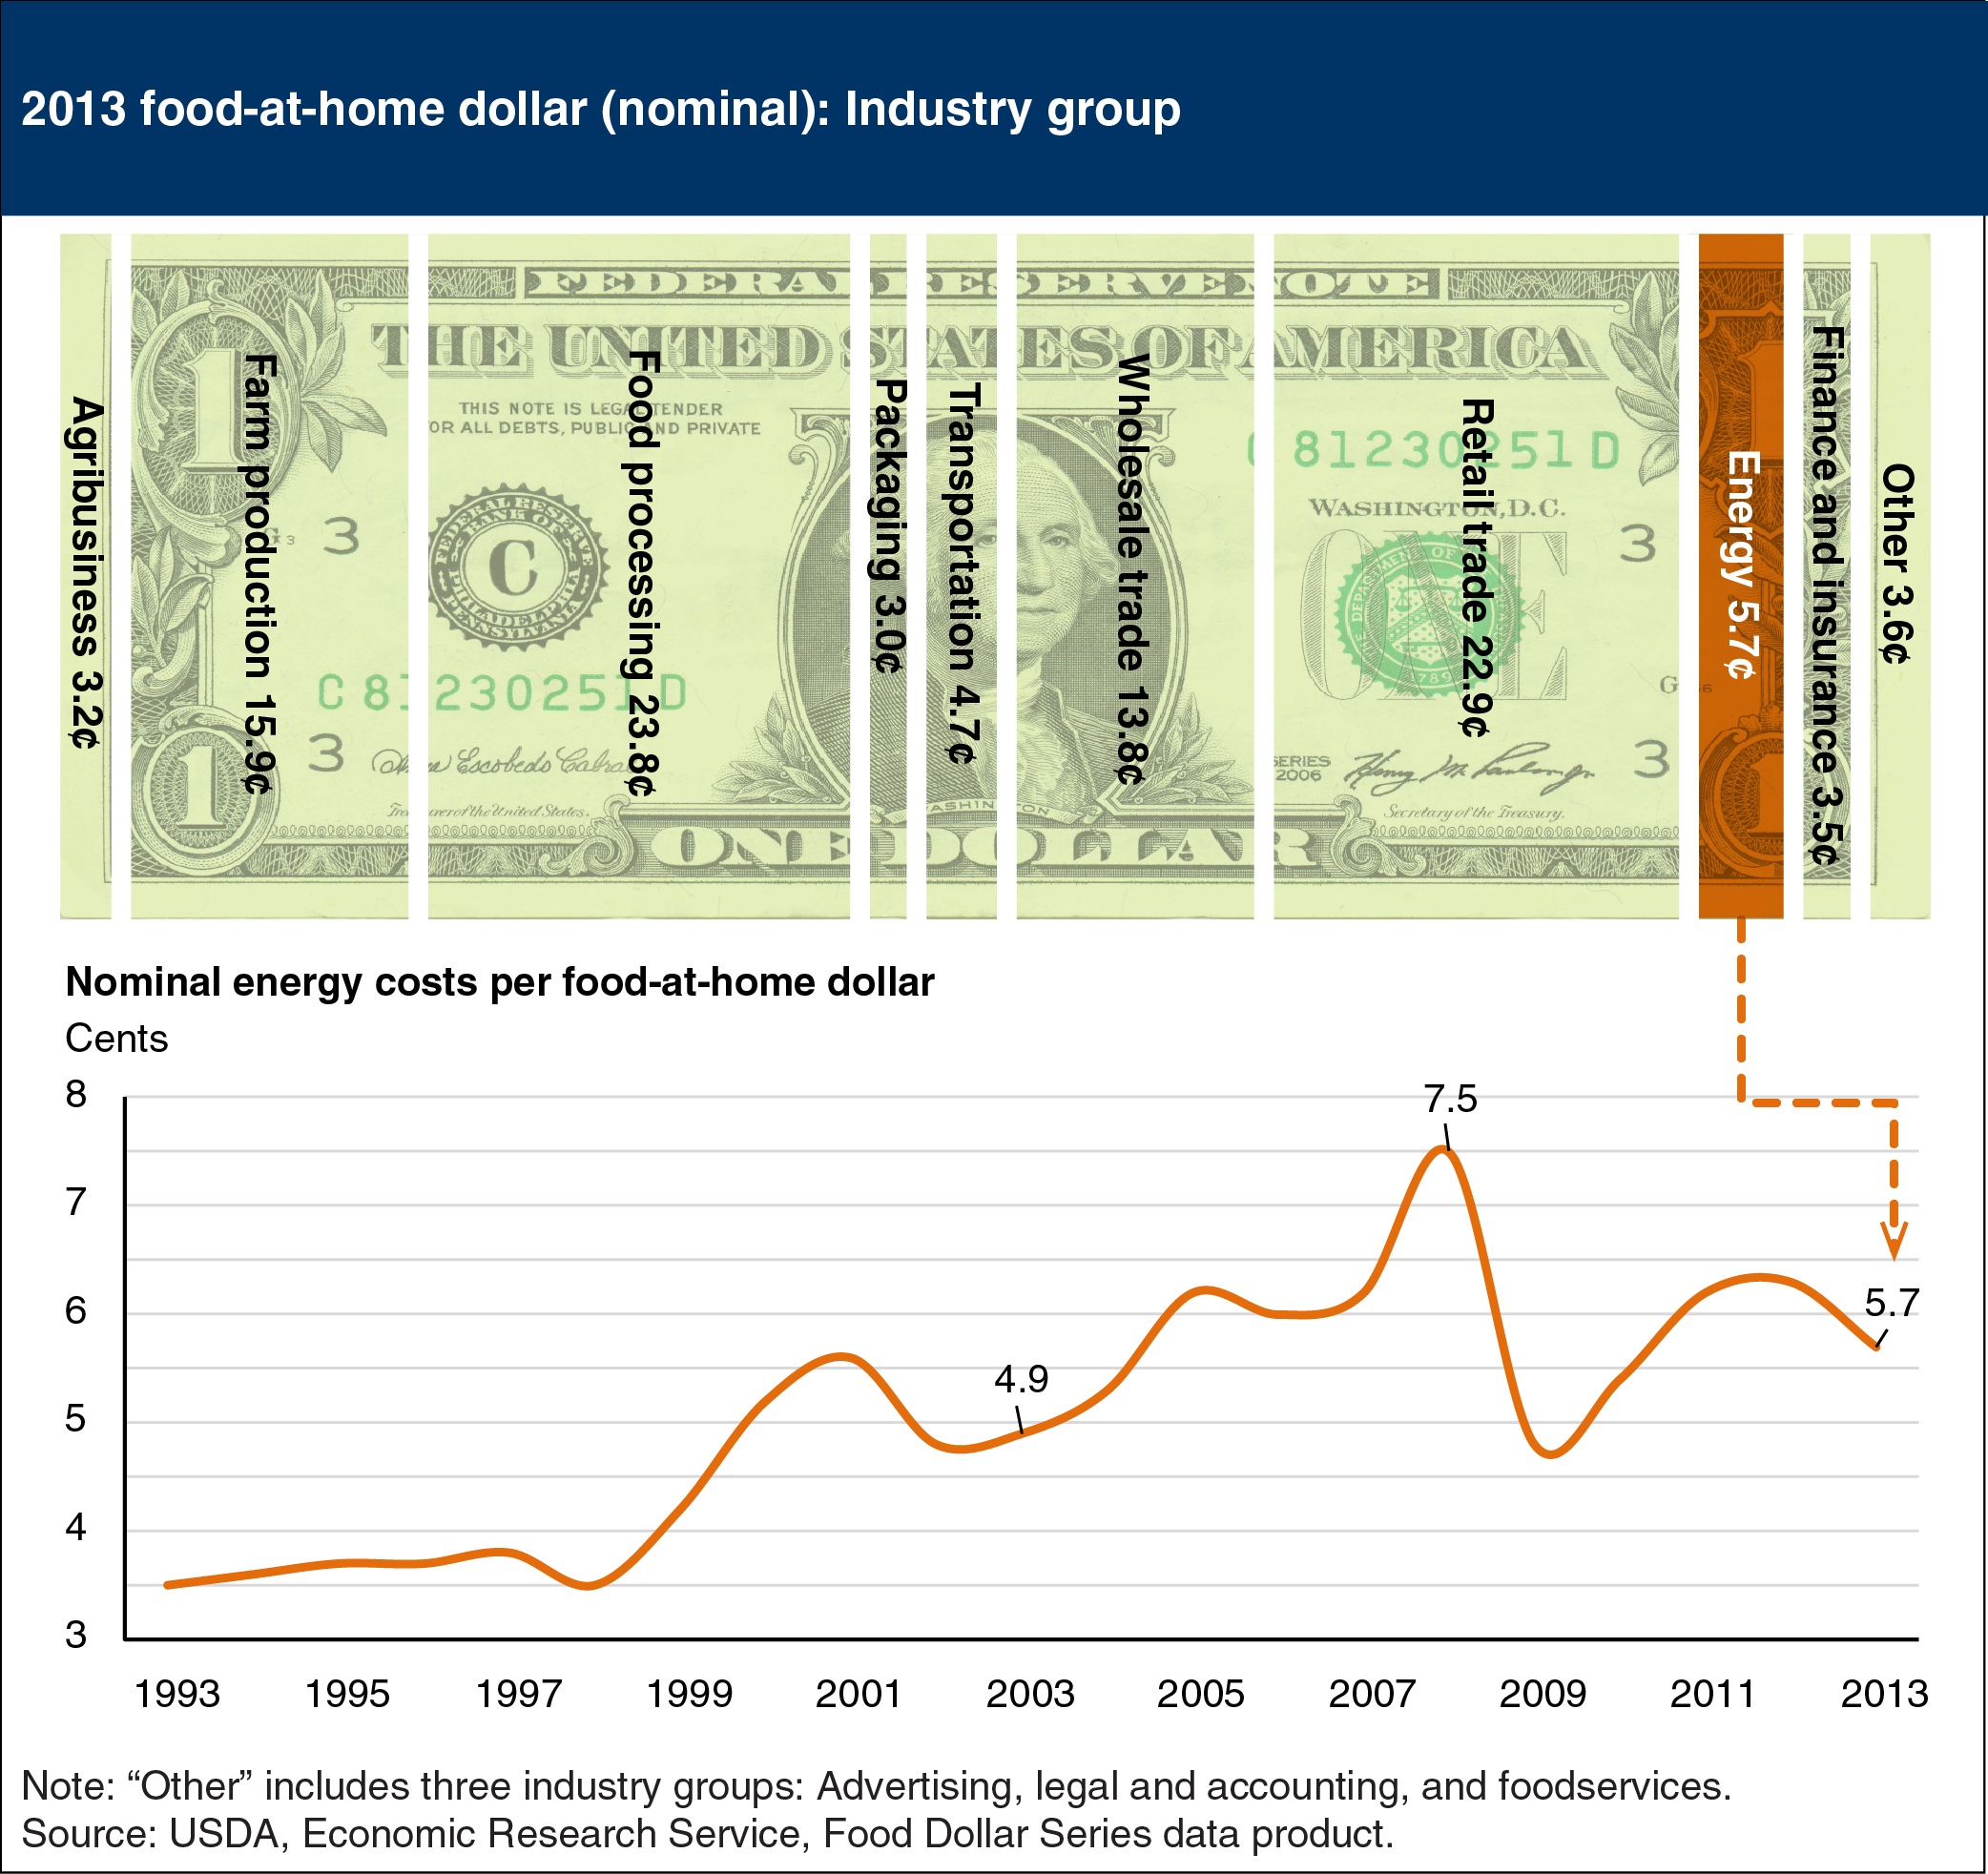
In 2013, 5.7 cents of a typical dollar spent by U.S. consumers at retail food stores on domestically produced food represented value added from energy services such as electricity, natural gas, and petroleum products. Energy costs’ share of the food-at-home dollar in 2013 was down over 25 percent from 7.5 cents in 2008. In the 5 years prior to 2008, energy costs per food-at-home dollar rose over 50 percent from 4.9 cents in 2003. By comparison, prices received by energy producers for their electricity, motor fuels, and other products—as measured by the Bureau of Labor Statistics’ Producer Price Index for fuels and power—rose by 90 percent from 2003 to 2008. Energy’s share of the food-at-home dollar rose less than energy prices, reflecting adjustments made by the food industry to reduce energy use during times of rising energy prices. In addition, some consumers likely adjusted the mix of foods they purchased as prices for more energy-intensive foods increased relative to less energy-intensive alternatives. For example, energy costs are a higher share of the retail price of processed fruit than of fresh fruit. This chart is from ERS’s Food Dollar Series data product.