
Rural school districts and those in the Southwest reported largest lunch price increases
- by Katherine Ralston
- 11/6/2015
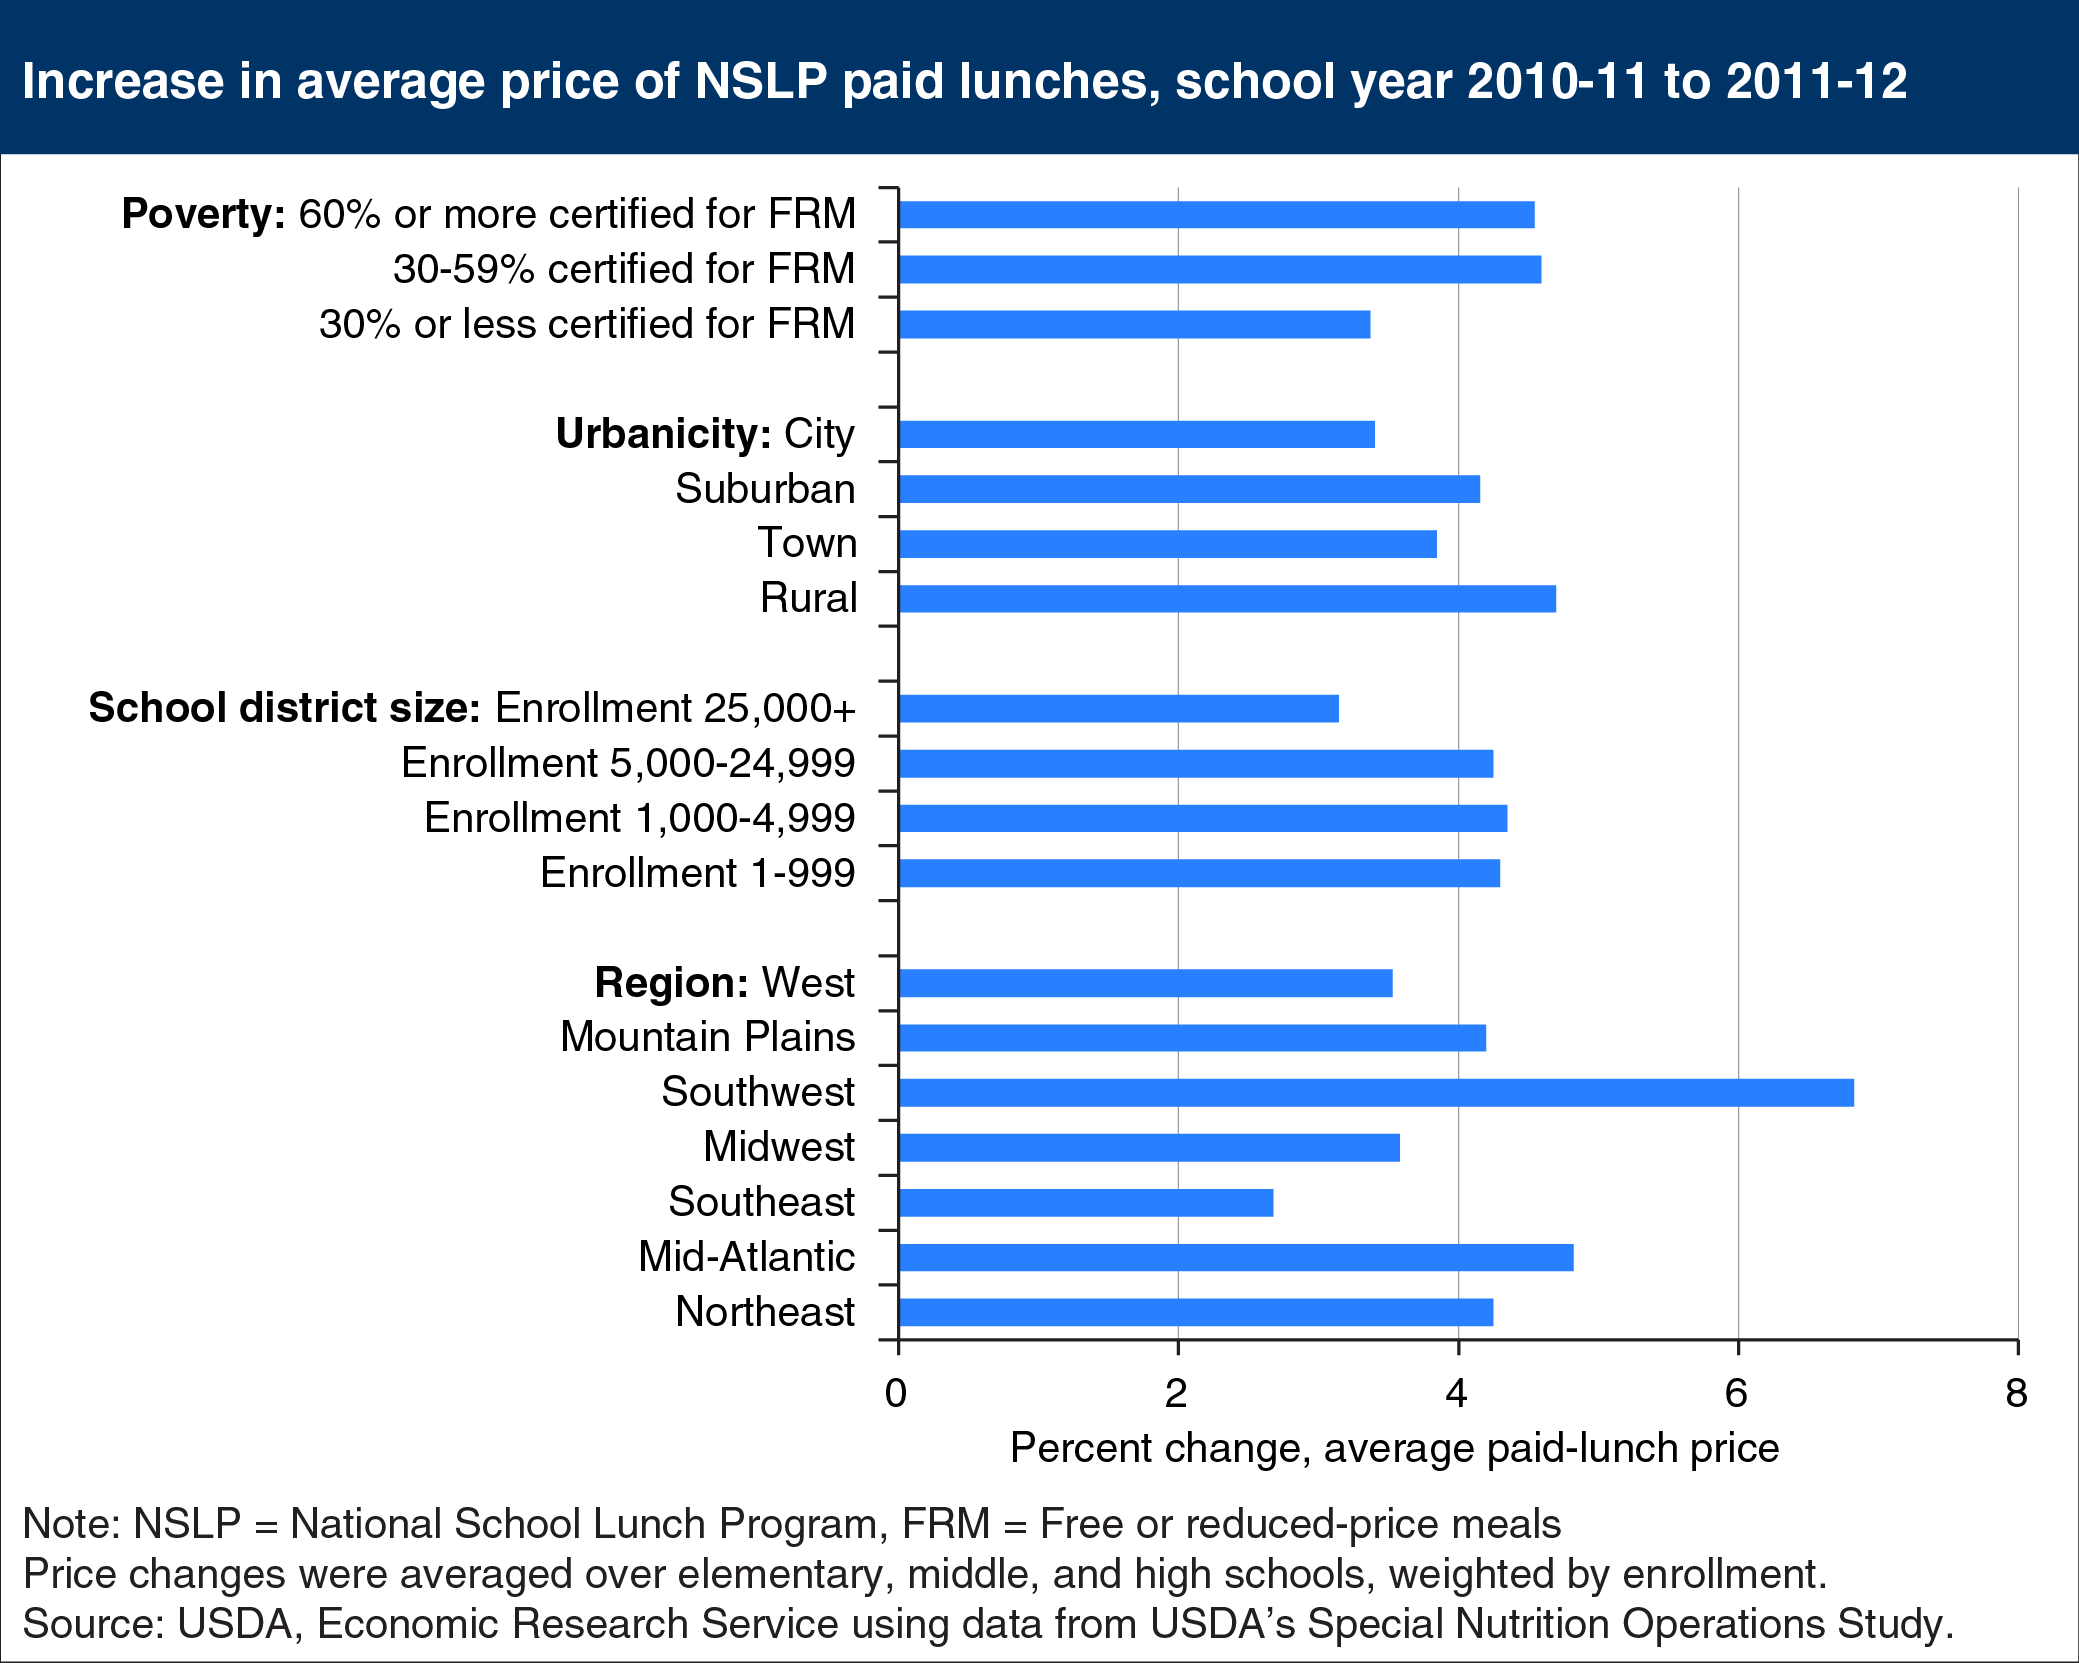
In 2014, over 30 million U.S. schoolchildren participated in USDA’s National School Lunch Program on an average school day. Seventy-two percent of them received their meals for free, or paid a reduced price; the remaining 28 percent purchased the full-price, or paid, lunch. Until a few years ago, prices charged for paid lunches generally increased slowly to cover rising costs of producing school lunches. Starting in school year 2011-12, many districts raised prices more sharply to comply with the Paid Lunch Equity provision, which went into effect that year. This provision requires school districts to gradually ensure that average revenue per paid lunch plus the USDA paid lunch reimbursement is at least as high as the USDA reimbursement for free lunches. Paid-lunch prices rose by an average of 6.8 percent for school districts in the Southwest and 4.8 percent in the Mid-Atlantic between school years 2010-11 and 2011-12, according to ERS calculations using data from a USDA-sponsored study. Rural school districts reported an average increase of 4.7 percent in paid-lunch prices compared to an increase of 3.4 percent for city districts. Areas with higher price increases may experience greater reductions in paid-lunch participation since research shows that some families cut back on school lunch purchases when lunch prices rise. This chart appears in “A Look at What’s Driving Lower Purchases of School Lunches” in the October 2015 issue of ERS’s Amber Waves magazine.