
Prevalence of food insecurity in 2014 was essentially unchanged from 2013 and 2012, down from 2011
- by Matthew P. Rabbitt and Alisha Coleman-Jensen
- 9/9/2015
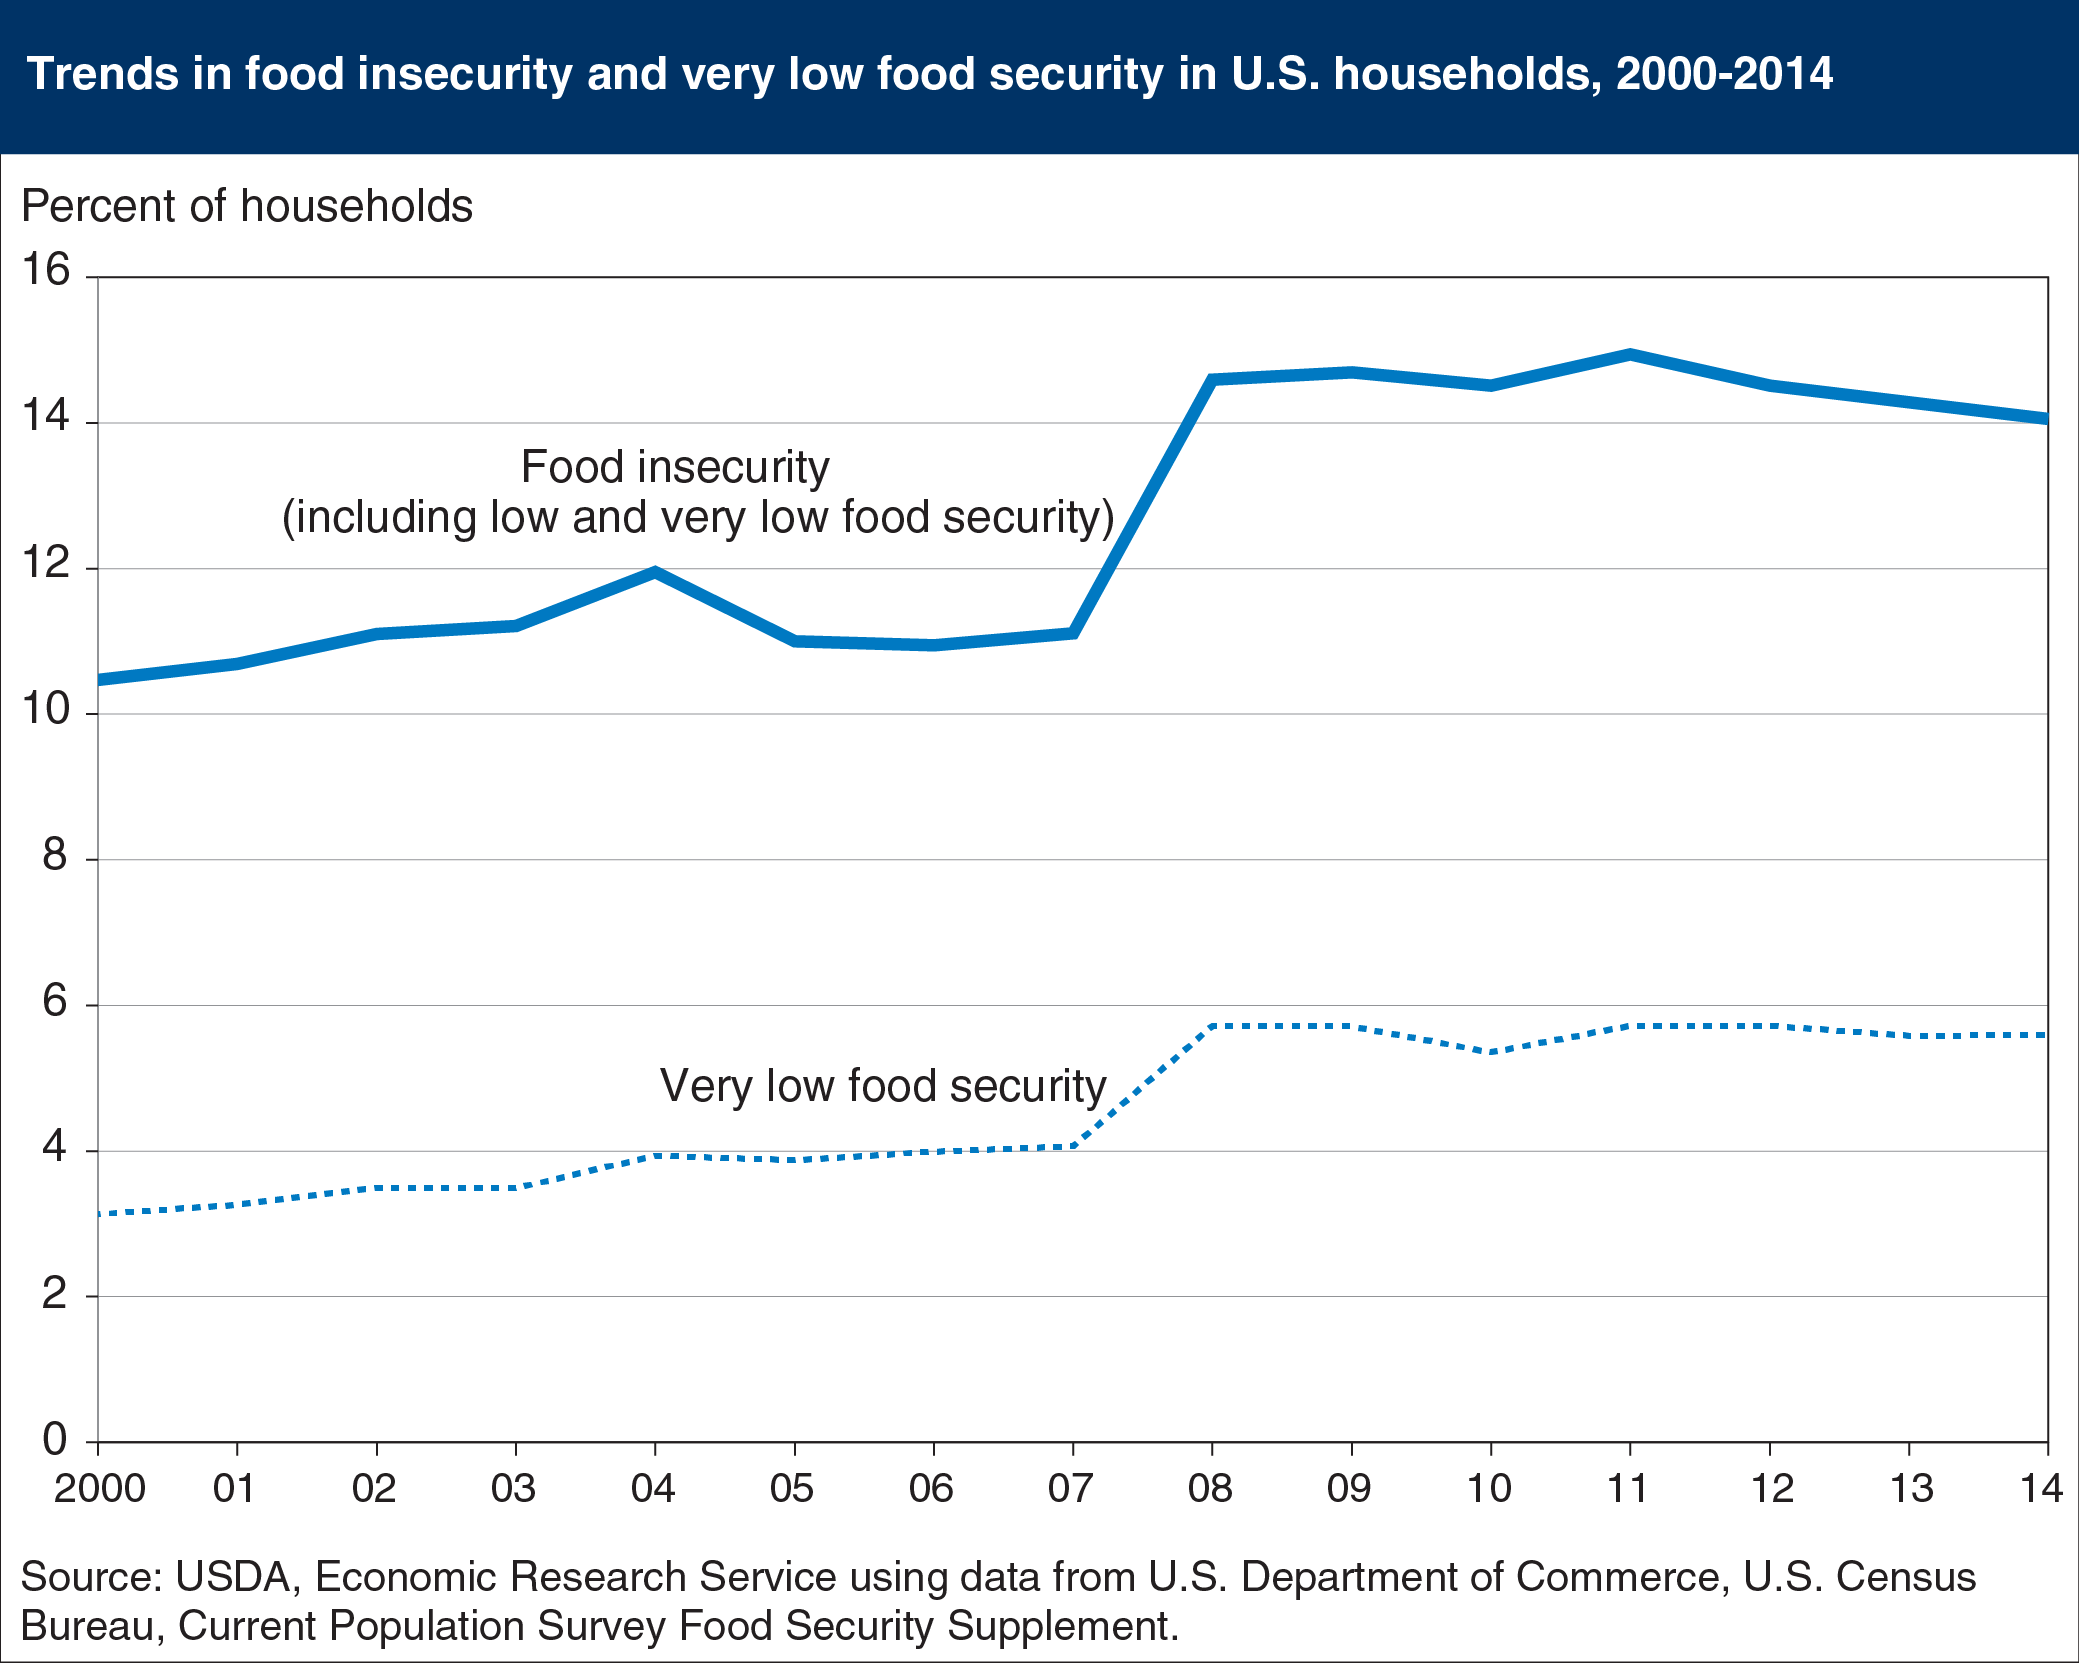
In 2014, 86.0 percent of U.S. households were food secure throughout the year. The remaining 14.0 percent (17.4 million households) were food insecure. Food-insecure households had difficulty at some time during the year providing enough food for all their members due to a lack of resources. While food insecurity has declined from 14.9 percent in 2011, the percent of U.S. households that were food insecure remained essentially unchanged in 2013 and 2014, despite a falling unemployment rate in those years. Higher inflation, especially higher food prices, and the end of increased food assistance benefits from the 2009 American Recovery and Reinvestment Act, strained low-income households’ food budgets and offset the effect of lower unemployment. In 2014, 5.6 percent of U.S. households (6.9 million households) had very low food security, essentially unchanged from 2012 and 2013. In this more severe range of food insecurity, the food intake of some household members was reduced and normal eating patterns were disrupted at times during the year due to limited resources. This chart appears in Household Food Security in the United States in 2014, ERR-194, released September 9, 2015.