
Participation rate for full price paid lunches in USDA's National School Lunch Program declined after 2008
- by Katherine Ralston
- 9/2/2015
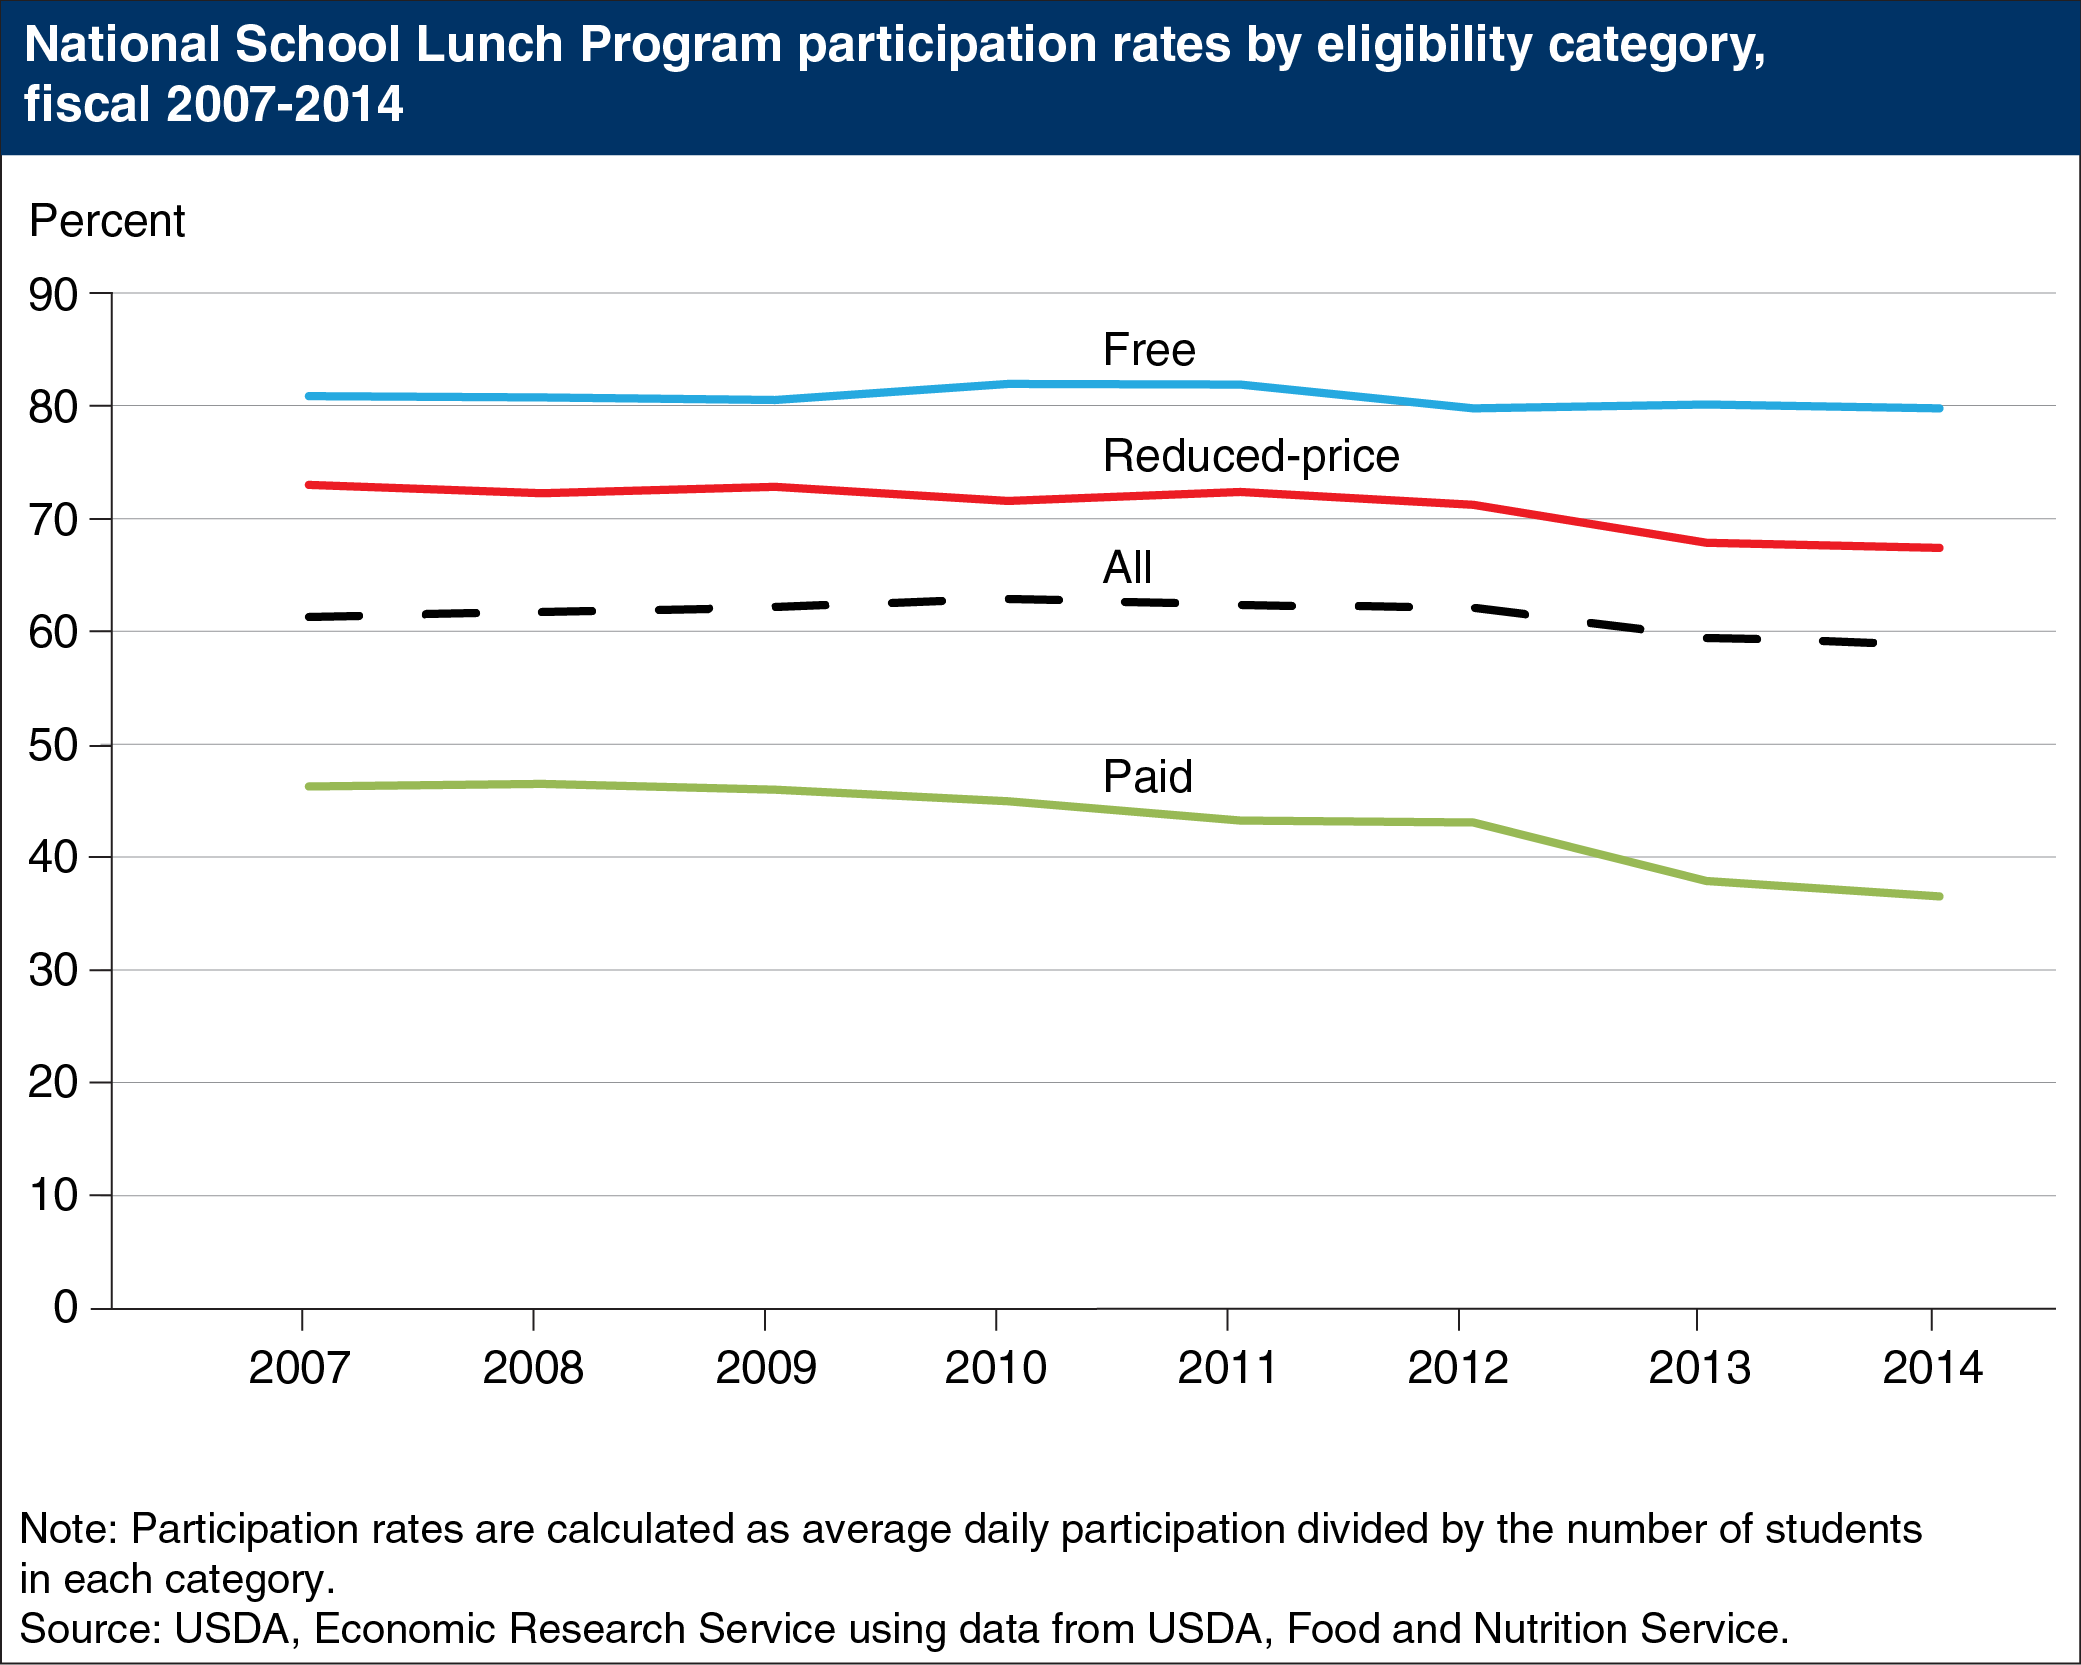
Since its start in 1946, USDA’s National School Lunch Program (NSLP) has offered and served lunches to children of all income levels. Based on household income, eligible students can receive their lunches for free or at a reduced price. Students not approved for free or reduced price lunches can purchase NSLP lunches at the “paid lunch” price. For reduced price and paid lunches, participation rates—the share of students in each certification category who participate—have fallen in recent years. In fiscal 2014, 67 percent of students approved to receive reduced price meals took the reduced price lunch, down from 73 percent in fiscal 2009. After increasing during the 2000s, the paid lunch participation rate fell from 47 percent in fiscal 2008 to 37 percent in fiscal 2014. The participation rate for free lunches has been fairly constant at around 80 percent over 2007-2014. A combination of reasons may be affecting NSLP participation, including tougher economic times leading more parents to pack their children’s lunches rather than buy lunch, as well as recent changes to NSLP meal requirements and price increases for paid lunches. This chart is from the ERS report, School Meals in Transition, released on August 20, 2015.