
Average net cash income for farm businesses is forecast down in all regions in 2015
- by Kevin Patrick
- 4/2/2015
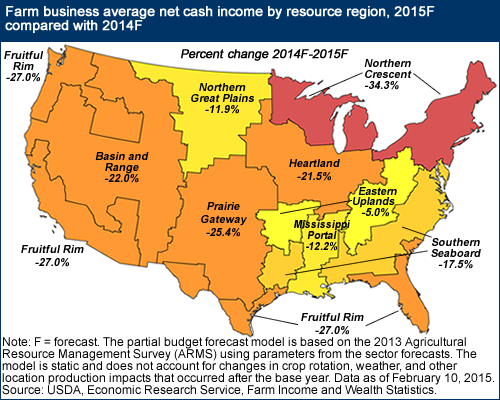
After historically high average net cash farm income (NCFI) in 2012 and 2013, average NCFI is expected to decline 22.7 percent in 2014F-15F for U.S. farm businesses (defined as farms with annual gross cash farm income greater than $350,000, or smaller operations where the operator’s primary occupation is farming), the lowest level since 2010-11 While declines are expected in all ERS resource regions, performance is expected to vary considerably, primarily driven by the regional commodity production specializations. The forecast sharp drop in dairy receipts contributes to an expected 34-percent decline in average NCFI in the Northern Crescent. The forecast decline in NCFI for the Fruitful Rim is driven by the expected drop in NCFI for specialty crop farms. Farm businesses’ average NCFI in the Basin and Range is forecast to decline due to declining receipts for sorghum and wheat. Expected declines in poultry and hog receipts drive lower projected average NCFI in the Eastern Uplands, while increasing livestock costs and decreasing crop receipts contribute to the decline in the Southern Seaboard. This map is found in the ERS topic page on Farm Business Income and the data are available in the February 2015 release of Farm Income and Wealth Statistics.