
On average, Americans spend just under 10 percent of their incomes on food
- by Annette Clauson and Howard Elitzak
- 2/26/2015
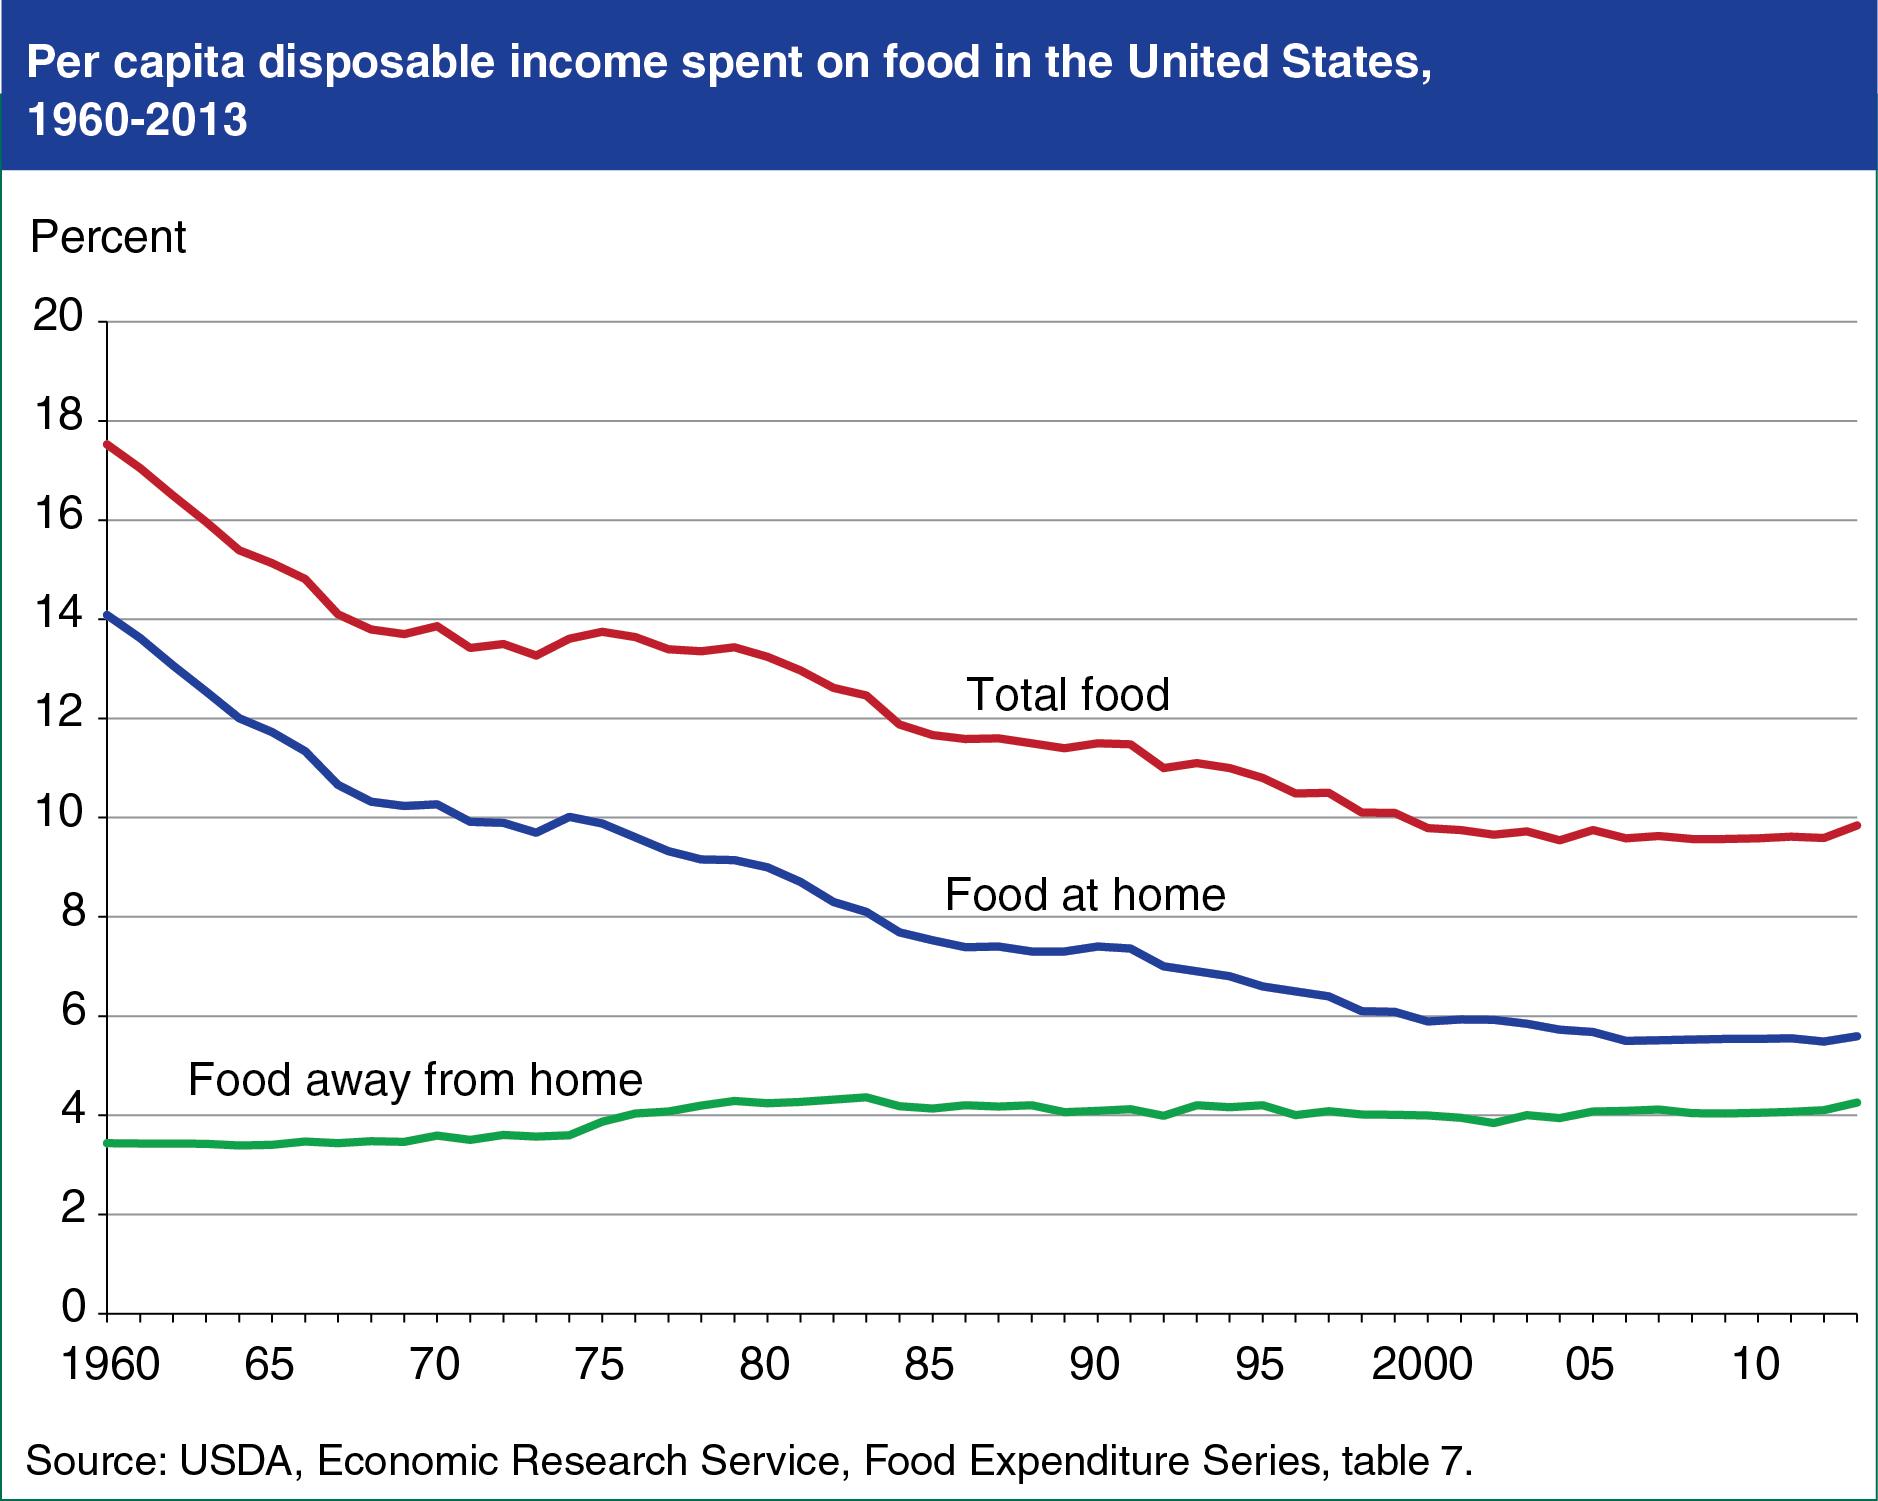
Between 1960 and 2007, the share of disposable personal income spent on total food by Americans fell from 17.5 to 9.6 percent, as the share of income spent on food at home fell. The share of income spent on food purchased in grocery stores and other retailers declined from 14.1 percent in 1960 to 5.5 percent in 2007. At the same time, the percent of income spent on food purchased at restaurants, fast food places, and other away-from-home eating places increased from 3.4 to 4.1 percent. The share of income spent on total food began to flatten in 2000, as inflation-adjusted incomes for many Americans have stagnated or fallen over the last decade or so. In addition, between 2006 and 2013, food price inflation has been greater than overall inflation, making food more costly. In 2013, Americans spent 5.6 percent of their disposable personal incomes on food at home and 4.3 percent on food away from home. This chart appears in the ERS data product, Ag and Food Statistics: Charting the Essentials. More information on U.S. food sales and expenditures can be found in ERS’s Food Expenditures data product.