
U.S. food sales evenly split between at-home and away-from-home markets
- by Howard Elitzak
- 1/14/2015
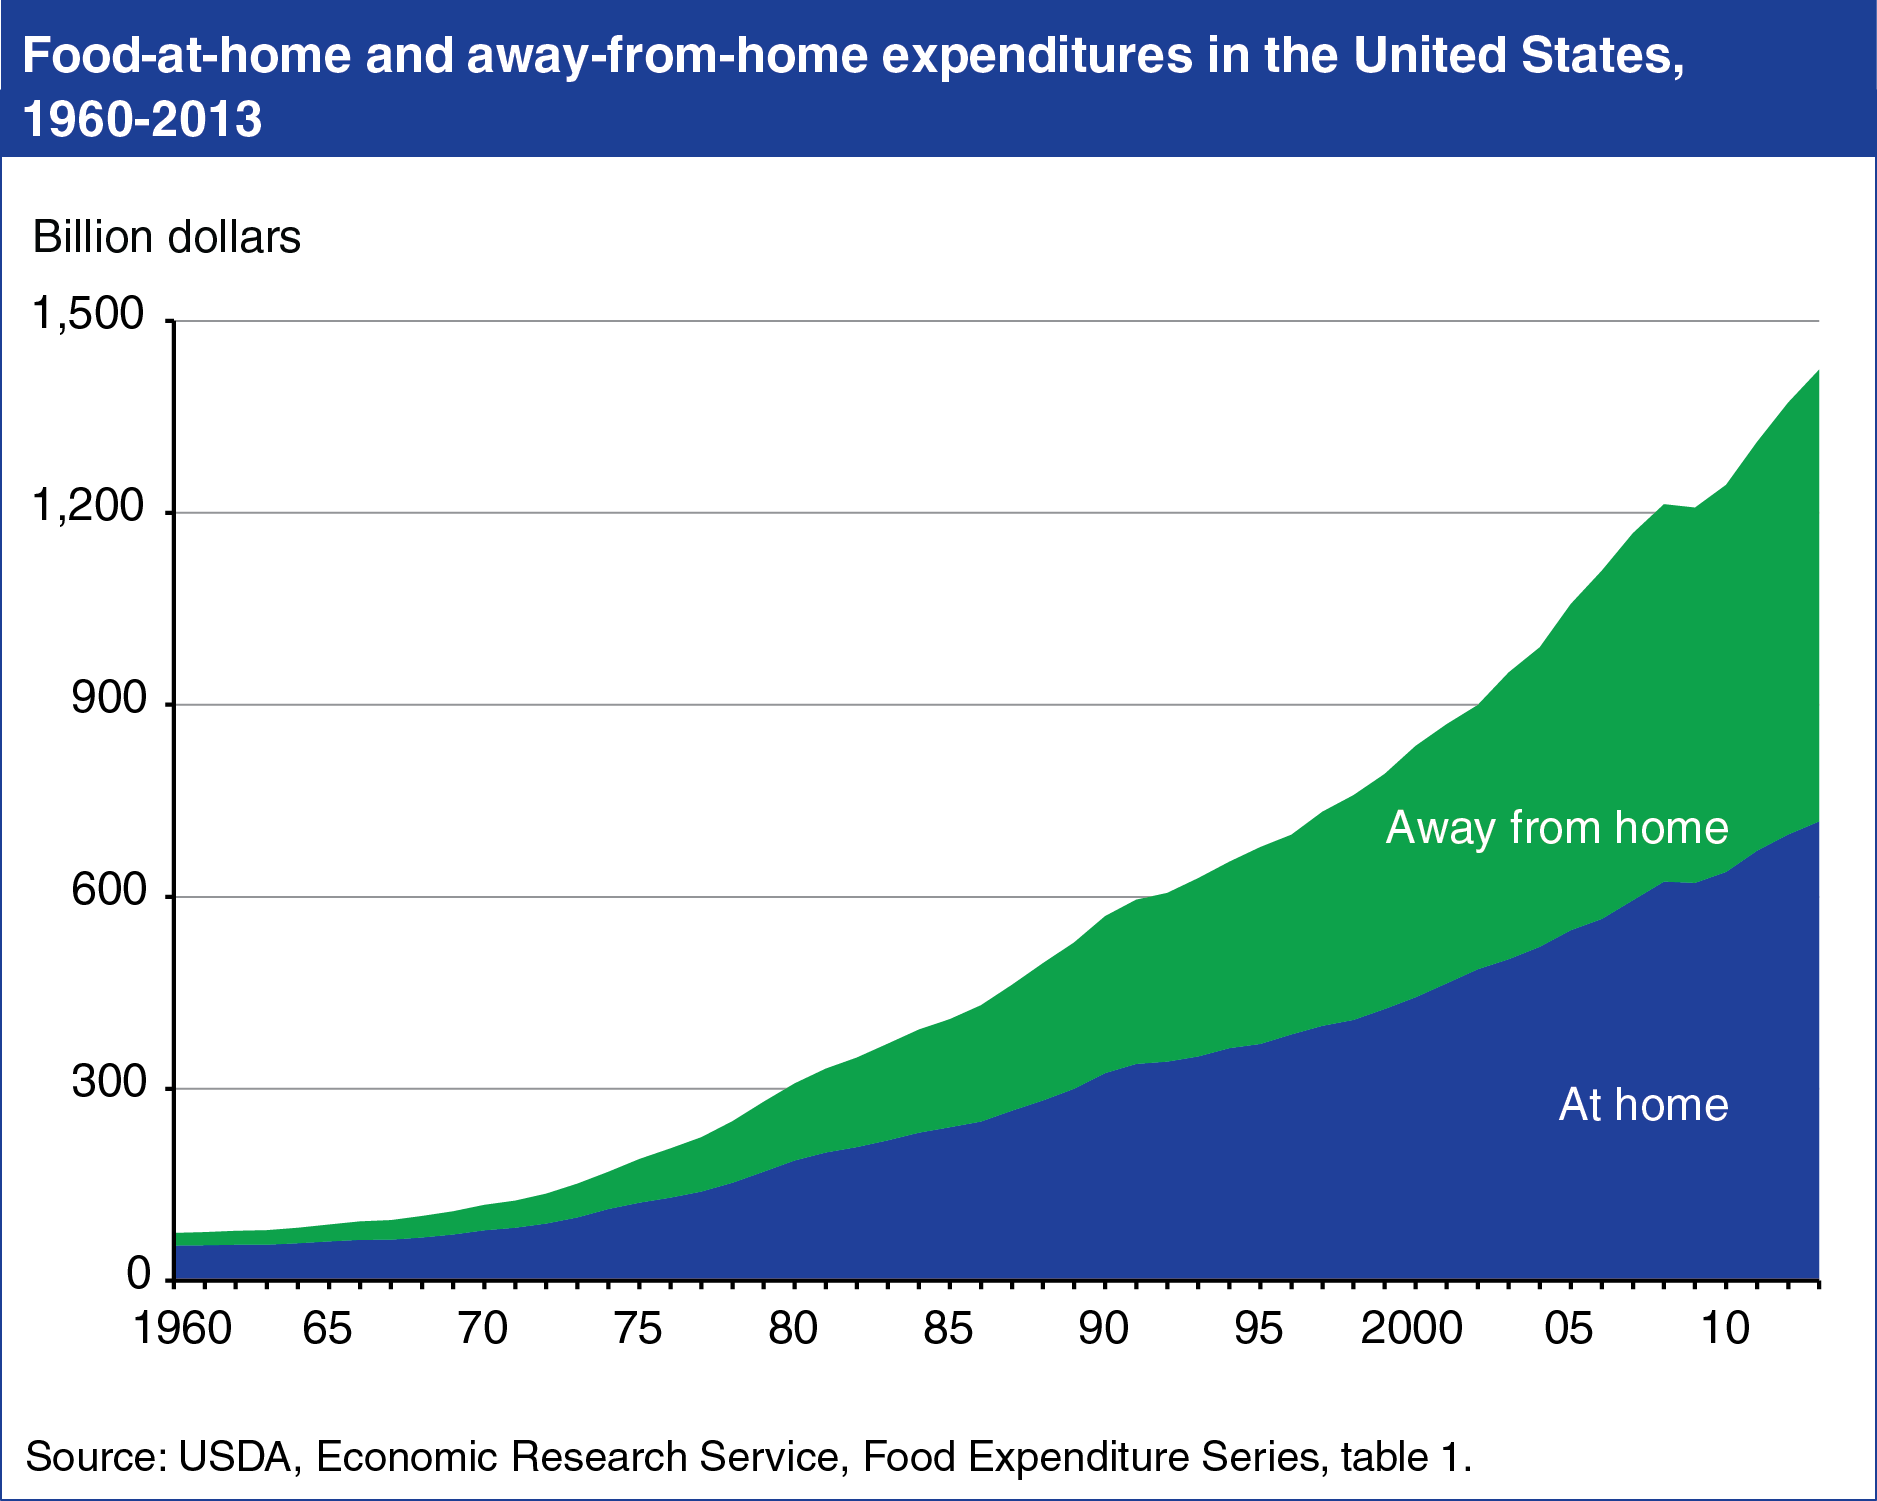
In 2013, spending at grocery stores and other retailers accounted for 50.4 percent of the $1.4 trillion spent on food and beverages by U.S. consumers, businesses, and government entities. The remaining 49.6 percent took place at restaurants, school cafeterias, food concession stands at movie theaters and ball parks, and other away-from-home eating places. In 1960, the away-from-home market had a 26.3-percent share of total food expenditures, and its share has grown through the decades except in some recession years. Most recently, food-away-from-home’s share of total food spending fell from 49.1 percent in 2007 and did not rebound to its pre-recession share until 2012. Two-earner households and busier lifestyles have led consumers to spend less time cooking and seek the convenience of food prepared away from home. This chart appears in the ERS data product, Ag and Food Statistics: Charting the Essentials. More information on U.S. food sales and expenditures can be found in ERS’s Food Expenditures data product.